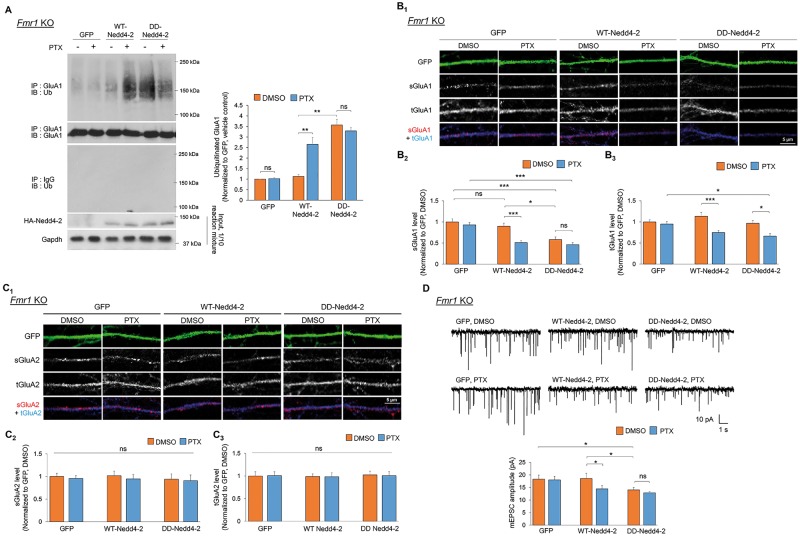
Figure 4.
Phosphorylation of Nedd4-2 reduces GluA1 levels and excitatory synaptic strength in Fmr1 KO neurons. (A) Western blots of Ub after IP using anti-GluA1 antibody from Fmr1 KO cortical neuron cultures lentivirally transfected with control GFP, HA-WT-Nedd4-2 (WT-Nedd4-2), or HA-S342D-S448D-Nedd4-2 (DD-Nedd4-2) and treated with vehicle (DMSO) or PTX for 48 h (n = 5). (B, C) Immunocytochemistry showing total (t) and surface (s) GluA1 and GluA2 in representative dendrites of Fmr1 KO hippocampal neurons transiently transfected with control GFP, WT-Nedd4-2 or DD-Nedd4-2 and treated with DMSO or PTX for 48 h. Quantification of total or surface GluA1 and GluA2 normalized to the average intensity of that in GFP-transfected, DMSO-treated neurons are on the bottom (n = 18–26 cells for Fmr1 KO neurons). (D) Patch-clamp recording from Fmr1 KO hippocampal neurons transiently transfected with control GFP, WT-Nedd4-2 or DD-Nedd4-2 and treated with DMSO or PTX for 48 h. Representative mEPSC traces and quantification of mEPSC amplitude are shown (n = 18–20 for Fmr1 KO neurons). Data were analyzed by two-way ANOVA with Tukey’s test and represented as mean ± SEM with *P < 0.05, **P < 0.01, ***P < 0.001 and ns: non-significant.

