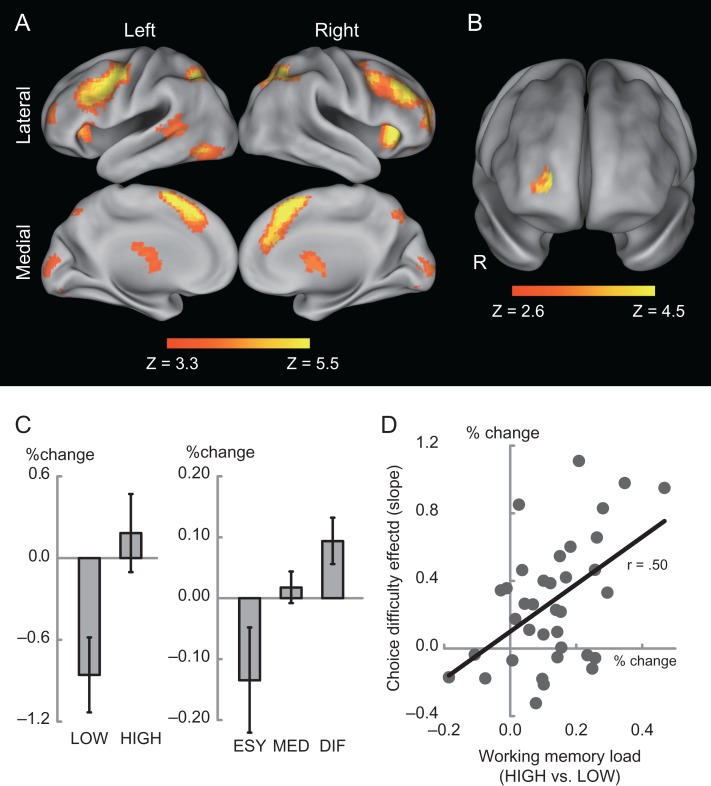
Figure 3.
(A) Statistical significance map of the contrast HIGH versus LOW in WM trials. Statistical maps were color coded and overlaid on the 3D standard anatomical template. Color indicates statistical level, as indicated in the color bar below. (B) Statistical significance maps of the choice-difficulty effect in intertemporal choice task. Format is similar to those in panel A. R, right. (C) Percentage signals in the aPFC for WM trials (left) and intertemporal choice trials (right). The horizontal and vertical axes indicate trial conditions and signal magnitude, respectively. Labels are identical as in Figure 2. (D) Scatter plot between WM-load and choice-difficulty effects in aPFC. The vertical and horizontal axes indicate percentage signals between WM effect and difficulty effect, respectively.

