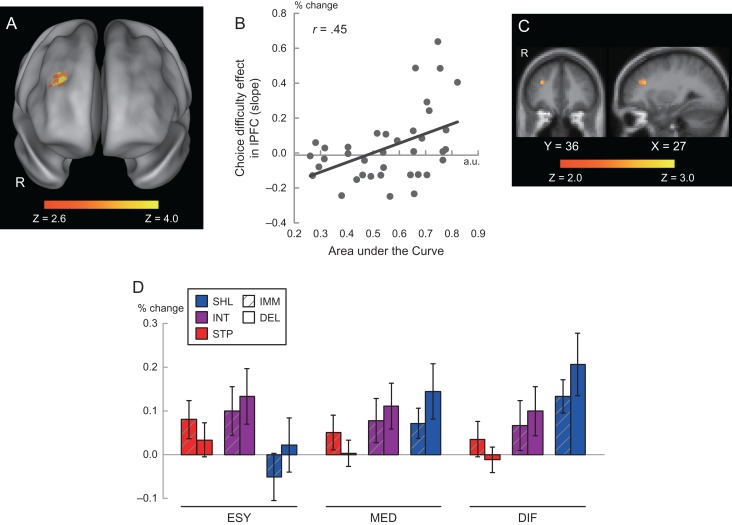
Figure 4.
(A) Statistical activation map for correlation between choice-difficulty effect and delay discounting (AuC). Formats are similar to those in Figures 2 and 3. (B) Scatter plot of AuC against percentage signals for choice-difficulty effect in dlPFC. (C) Statistical activation map for correlation between choice and delay discounting. Statistical maps were color coded and overlaid on the 2D slices of standard anatomical template, as indicated by the X and Y levels below. (D) Percent signals during intertemporal choice trials. Red, purple, and blue bars indicate steep (STP), intermediate (INT), shallow (SHL) discounting groups, respectively. Open bars and bars with slant lines indicate trials where the delayed (DEL) and immediate (IMM) choices were chosen, respectively. ESY: easy; MED: middle; DIF: difficult.

