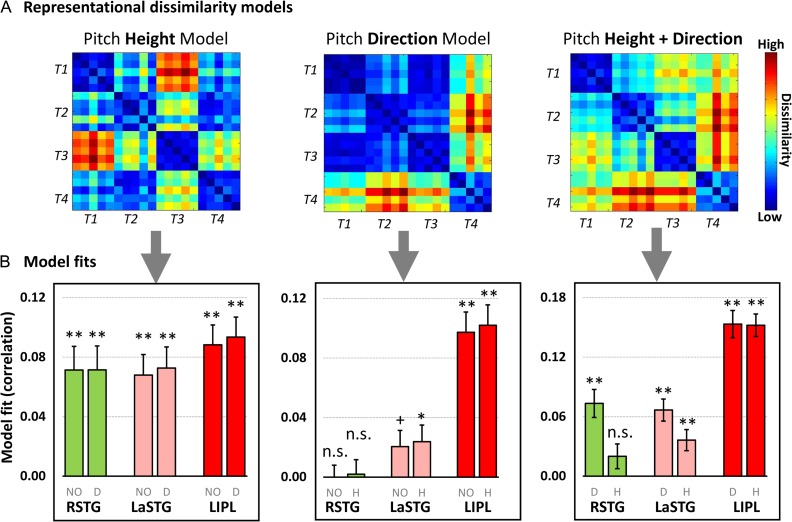
Figure 5.
RSA on the 3 regions that were identified by the searchlight cross-task tone classification analysis. (A) Three hypothesized dissimilarity matrices, which were constructed by calculating the distance between each pair based on pitch height, direction and both height and direction dimensions (see Fig. 4 for details); (B) Model fits (Spearman rank correlations) between hypothesized models and fMRI dissimilarity matrices were showed. The gray color labels under each bar represent different model fit methods: NO, not controlled the variance of any model; D, controlled the variance of the pitch direction model; H, controlled the variance of the pitch height models. **, P < 0.01; *, P < 0.05; +P < 0.1; n.s., not signification. Error bars denote standard error of the mean.

