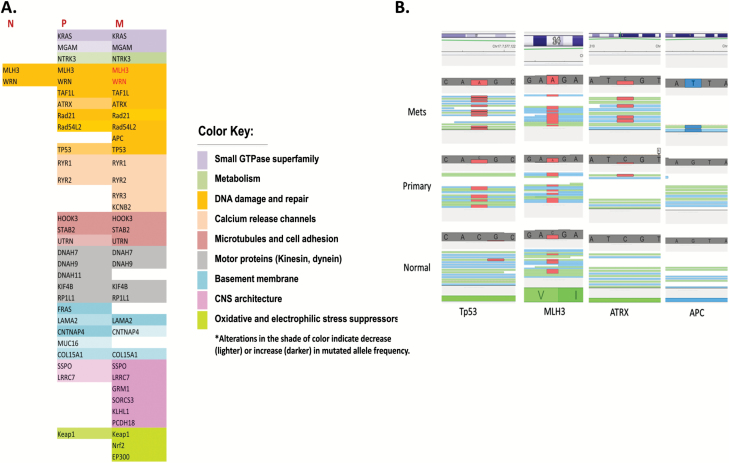
Figure 2.
Somatic mutations identified in the primary NSCLC tumours and their corresponding metastases. (A) A table listing mutations detected in all the five patients and were categorised into different functional groups. An increase in colour intensity indicates enrichment in mutant population as indicated by an increase in the number of reads from the sequencing data. N, normal; P, primary; M, metastasis. Low-intensity colour corresponds to a low number of supporting reads for the mutation (indicative of small allele frequency) and the high-intensity colour corresponds to a higher number of supporting reads (indicative of high allele frequency). (B) Mutations detected in some DNA damage and repair genes from four patients (Tp53, MLH3, ATRX and APC). The red colour indicates a mutation to an adenine base (A), and the blue colour indicates a mutation to a thymine base (T). Genes that lost heterozygosity are in red.

