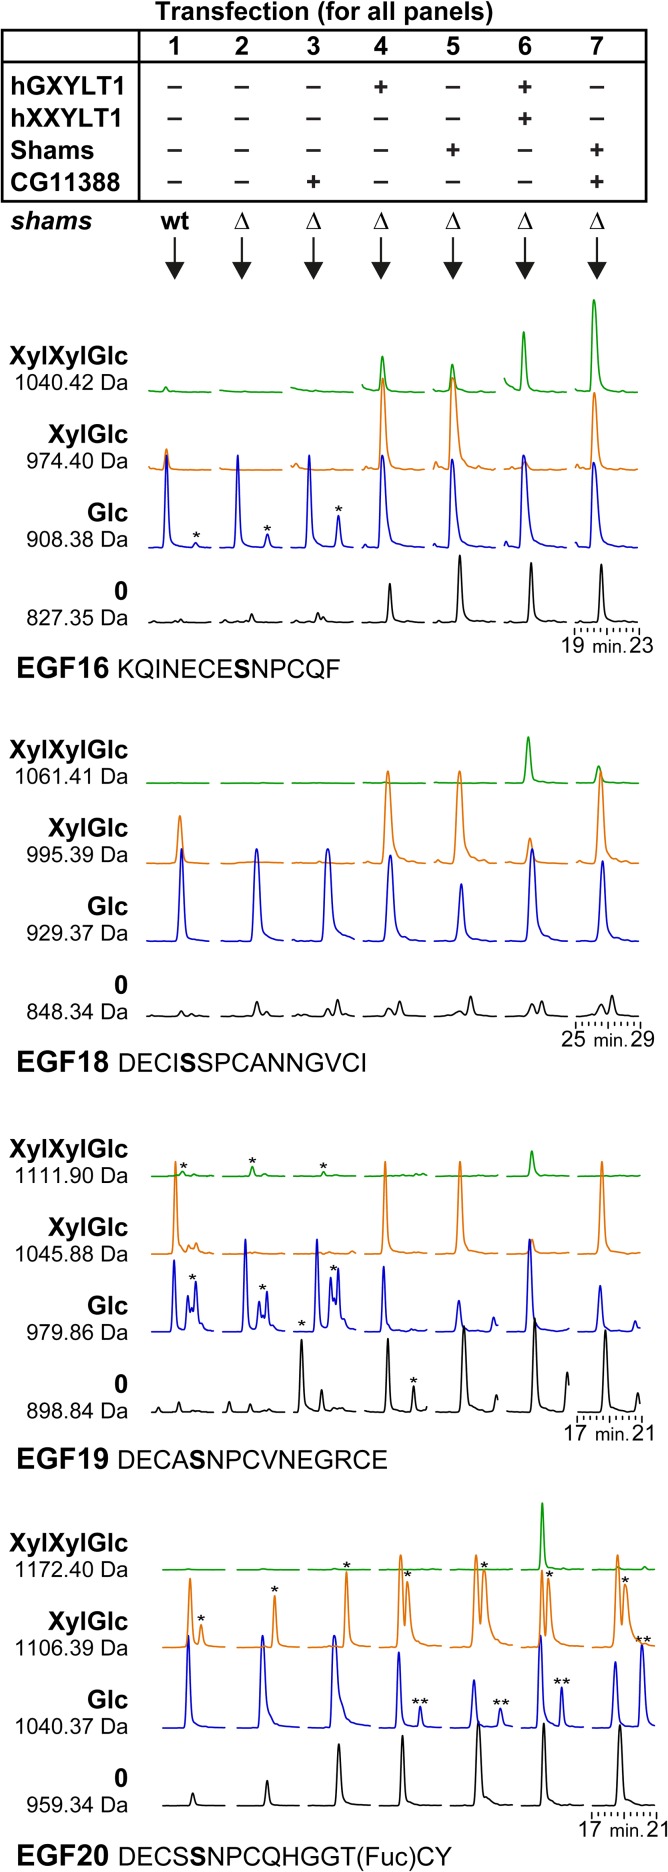
Fig. 1.
CG11388 functions as a xyloside xylosyltransferase on Drosophila Notch. A plasmid with His6-tagged EGF repeat 16 to 20 was transiently transfected into plain S2 cells, S2 cells lacking endogenous Shams (Δshams), or Δshams S2 cells co-transfected with expression vectors for the indicated human and fly proteins. AspN digested peptides from the purified protein were analyzed by mass spectrometry and revealed the glycosylation pattern of EGF16, 18, 19 and 20. Shown here are extracted ion chromatograms of expected masses of glycopeptides (all 2+). Black and blue chromatograms represent naked and O-glucosylated (monosaccharide) EGF repeats, respectively. Plain S2 cells (without any plasmid transfection) show limited xylosylation (column 1), which is completely abolished in Δshams cells (column 2). Both GXYLT1 and Shams (columns 4 and 5) formed xylose–glucose (XylGlc) and acted similarly on all four EGF repeats. Only EGF16 showed the relevant XylXylGlc peak, likely generated by the endogenous Xxylt. Simultaneous overexpression of human XXYLT1 or Drosophila CG11388 (columns 6 and 7) showed that the human enzyme was able to transfer a second xylose to all four EGF repeats, whereas the Drosophila enzyme only acted on EGF16 and to some extent on EGF18. Importantly, overexpression of CG11388 in Δshams S2 cells does not generate new glycopeptide peaks (column 3), confirming that CG11388 can only add the second xylose to xylose–glucose-O disaccharide. Of note, CG11388 showed relatively stronger activity on EGF16 compared to the human enzyme. For each peptide of each transfection condition, we set the highest peak as 100% and normalized the other peaks accordingly. For example, in EGF16 with hGXYLT and hXXYLT (column 6), the Glc peak is set at 100% and the other peaks are shown in proportion to this highest peak. Asterisks (*) mark nonspecific peaks that appeared within the extracted ion chromatograms because their m/z-values were similar to the search mass ± 0.3 Dalton. Double asterisks (**) mark peaks corresponding to the 1040.42 Da masses of EGF16 (XylXylGlc), which run close to the 1040.37 Da peaks of EGF20 (Glc). MS/MS spectra confirmed the identity of 1040.42, 1061.41 and 1172.40 peptides from the hGXYLT1 + hXXYLT1 sample (Supplementary data, Figures S1, S2 and S3).

