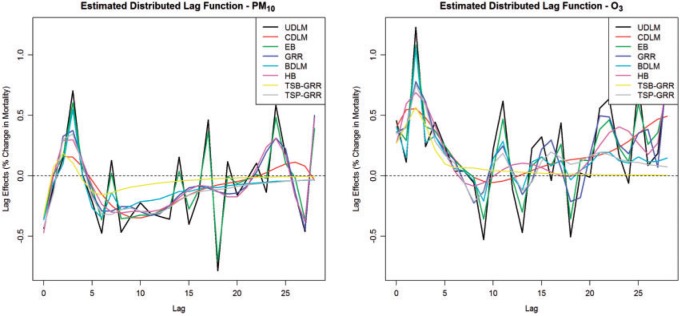
Fig. 3.
Estimated mean and 95% confidence/credible interval of the cumulative lagged effect (% change in mortality count) up to 3, 7, and 14 days of PM (left) and O
 (right) on mortality with an interquartile range increase in exposure level (PM
 : 21.49
  , O
, O : 14.65 ppb) in Chicago, IL from 1987 to 2000 based on the data from the NMMAPS under eight estimation methods.

