Fig. 3.
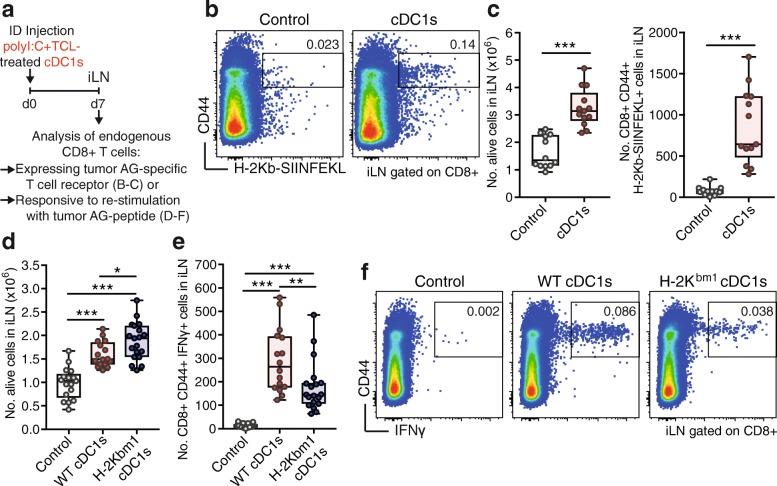
cDC1s cross-present tumor Ag to activate endogenous CD8+ T cells. a Schematic representation of experimental setup for data shown in (b-f). PBS control or 5 × 10⁵ poly I:C and B16-OVA TCL-loaded cDC1s were intradermally (ID) injected into mice and the draining inguinal lymph node (iLN) analyzed 7 days thereafter. b Representative plots and c (left panel) quantification by flow cytometry of total cell number and c (right panel) CD8+ CD44+ H-2Kb-SIINFEKL+ T cell number in iLN of mice ID injected with control PBS or 5 × 10⁵ poly I:C and B16-OVA TCL-loaded cDC1s. Combined data of 3 independent experiments with total n = 12 (Control) and n = 13 (cDC1s) mice are shown. ***P < 0.001 by Student’s t test. d-f Flow cytometric quantification of d total cell number and e CD8+ CD44+ IFNγ-producing cell number after re-stimulation with OVA257–264 peptide in iLN as well as f representative plots of mice ID injected with control PBS, 5 × 10⁵ poly I:C and B16-OVA TCL-loaded wildtype (WT) or H-2Kbm1-harboring (H-2Kbm1) cDC1s. Combined data of 3 independent experiments with total n = 17 (Control), n = 16 (WT cDC1s) and n = 19 (H-2Kbm1 cDC1s) mice are shown. *P < 0.05, **P < 0.01, ***P < 0.001 by one-way ANOVA and Tukey post hoc test

