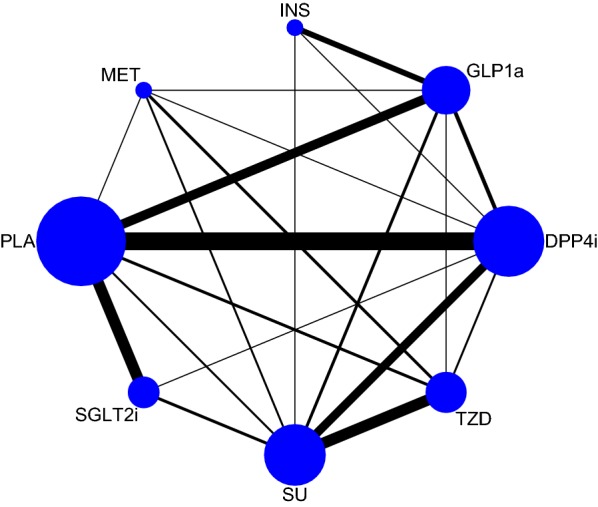
Fig. 1.

Network plot of treatment comparisons for heart failure. Direct comparison of treatment is linked with a line, the thickness of which represents the number of trials that assess the comparison. SGLT2i sodium-glucoseco-transporter 2 inhibitors, GLP1ra glucagon-like peptide-1 receptor agonists, DPP4i dipeptidyl peptidase 4 inhibitors, TZD thiazolidinediones, MET metformin, SU sulfonylureas, INS insulin, PLA placebo
