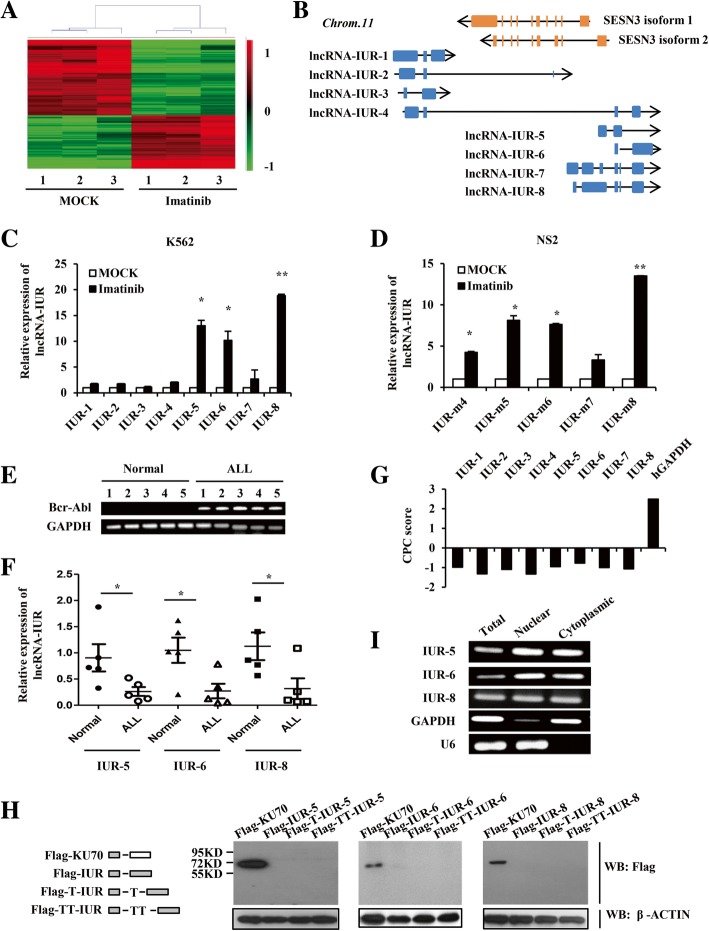
Fig. 1.
Identification of the novel imatinib-upregulated lncRNA family. a, The hierarchical clustering analysis of lncRNAs differentially expressed in K562 cells treated with or without imatinib (n = 3; fold change > 2.0; p < 0.05). The values from three independent experiments were displayed. The microarray analysis revealed 987 upregulated and 1479 downregulated lncRNAs upon treatment with imatinib. b, The paradigm of the human genomic location of lncRNA-IUR family (blue) and SESN3 (orange). The orientation of arrows indicated the transcription direction. c and d, Quantitative real-time PCR analysis of human lncRNA-IUR expression in K562 cells (c) and murine lncRNA-IUR expression in NS2 cells (d) in response to treatment with imatinib (n = 3; means ± SEM; **p < 0.01; *p < 0.05). e, RT-PCR analysis of Bcr-Abl expression in the primary peripheral blood lymphocytes from Bcr-Abl-positive ALL patients and normal subjects. f, Quantitative real-time PCR analysis of lncRNA-IUR expression in primary leukemic cells from Bcr-Abl-positive ALL patients and normal control (n = 5; means ± SEM; *p < 0.05). g, The CPC scores for each transcript of lncRNA-IUR family and control gene GAPDH (http://cpc.cbi.pku.edu.cn). h, LncRNA-IUR-5, 6, and 8 (full length) were cloned into pNL vector with N-terminal Flag tag in all three reading frames. The plasmids were transfected into 293 T cells for 48 h. Cell lysates were harvested and subjected to Western blotting (WB) with anti-Flag. Flag-KU70 served as a positive control. i, RT-PCR was performed to examine cytoplasmic or nuclear lncRNA-IUR expression in K562 cells. GAPDH served as a cytoplasmic control, and U6 as a nuclear control

