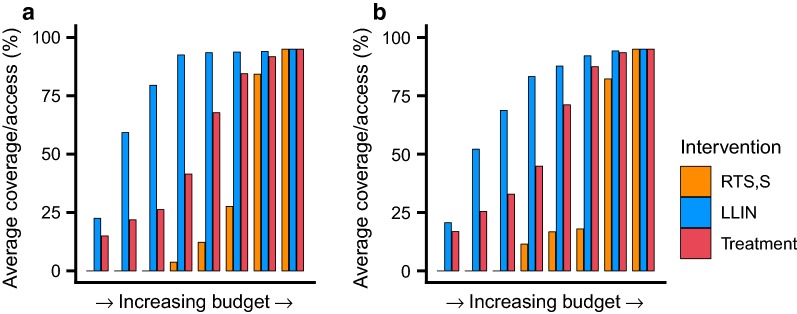
Fig. 4.
Cost-effective prioritization of LLINs, treatment and the RTS,S vaccine. The average cost-effective scale-up of access to LLINs (blue bars), coverage of treatment (red bars) and the RTS,S vaccine (orange bars) for a medium (baseline PfPr2-10: 30%) and b high (baseline PfPr2-10: 60%) perennial transmission settings

