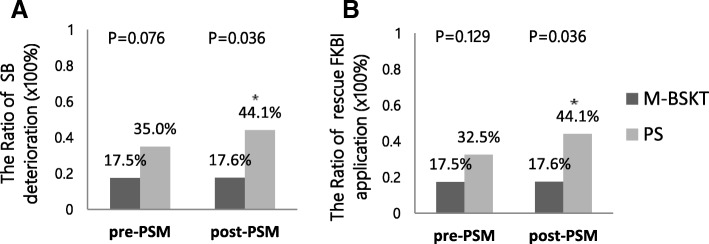
Fig. 3.
a The Ratio of SB deterioration. The P-values of the incidence of immediate SB deterioration between the 2 groups (pre-PSM and post-PSM). b The Ratio of rescue FKBI application. The P-values of the rescue FKBI application between the 2 groups (pre-PSM and post-PSM). PSM: propensity-matched analysis. FKBI: final kissing balloon inflation. * means P < 0.05

