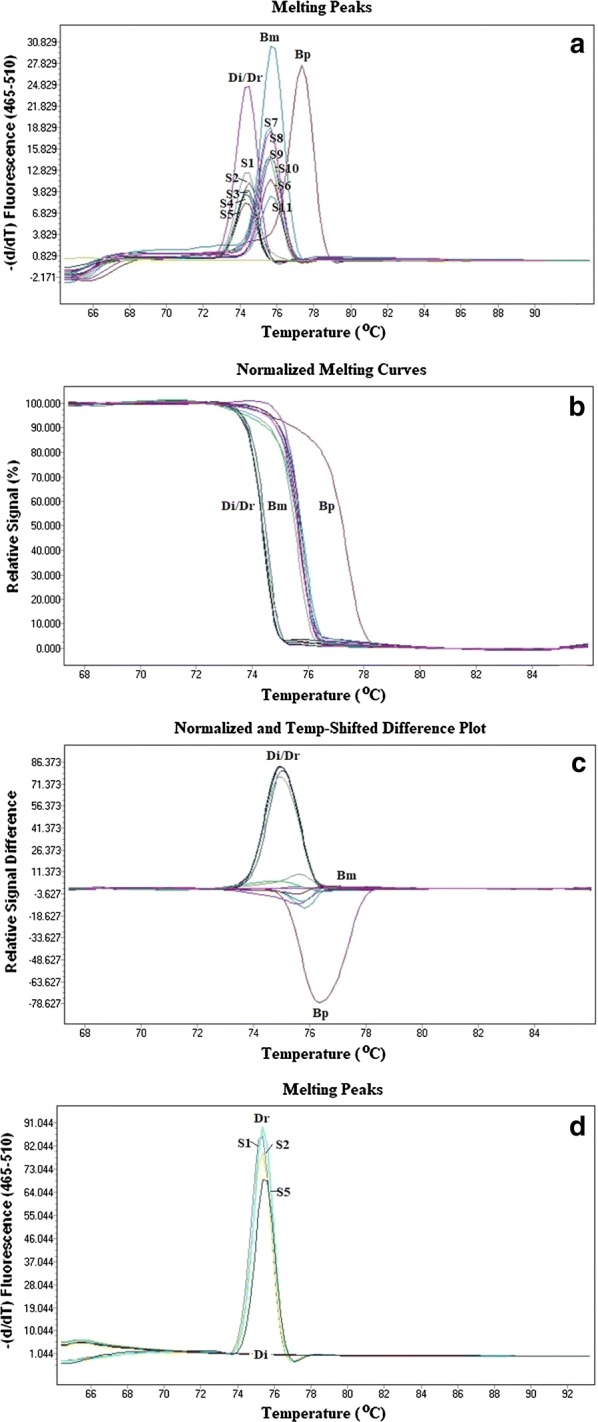
Fig. 5.

Melting peaks (a), normalized difference curves (b) and the normalized and temperature-shifted difference plot (c) of the amplified product of control species (B. malayi, B. pahangi and D immitis/D. repens) and S1-S11 representative DNAs from 34 mf-positive samples of cat blood and DNA from the 22 mf-positive samples using cox1 specific primers for D. repens, S1; S2; S5 represented the 22 mf-positive cat samples (d), as obtained with the LightCycler 480 gene scanning software. Abbreviations: Bm, B. malayi; Bp, B. pahangi; Di, D immitis/D. repens
