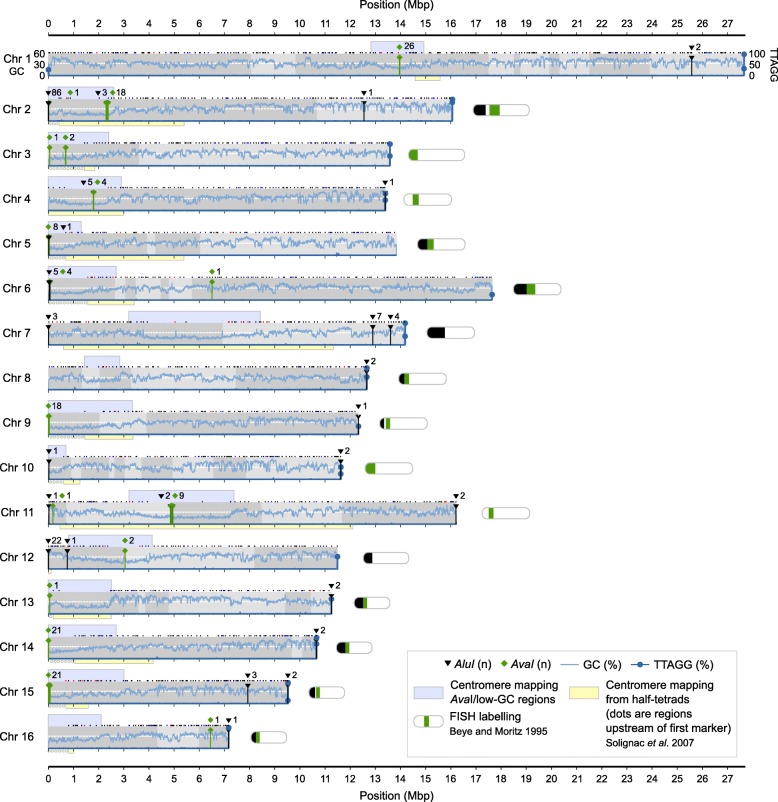
Fig. 2.
Assembly overview. An overview of the 16 linkage groups or chromosomes of Amel_HAv3 after anchoring and orienting the contigs according to the genetic map [38]. Grey shades indicate the intervals of each contig. Dots above each chromosome indicate the locations of genetic map markers (black = markers that are congruent with the assembly; red = markers that are incongruent, i.e. interleaved or reversed; blue = ambiguous markers, i.e. overlapping or widely separated primer sites). Genome-wide GC-content is indicated with a white dashed line and local %GC is mapped across all chromosomes (10 kbp non-overlapping windows; light-blue curve on y1-axis). The density of telomeric TTAGG/CCTAA repeats is shown (10 kbp non-overlapping windows; dark-blue curve on y2-axis; filled circles shown for values > 10%). Extended low-GC regions indicating putative centromere regions are shown above chromosomes (bounded by adjacent 100 kbp windows < genome-wide %GC; light-blue), whereas experimental centromere mappings from [31] are indicated below chromosomes (boxes bounded by genetic map markers; extended upstream to the tip of the chromosome as dots when the area started at the first genetic map marker; light-yellow). The locations of centromeric AvaI (green) and telomeric AluI (black) clusters, respectively, are marked along chromosomes. Miniature chromosome models are redrawn from [30] and indicate experimental detection of AvaI and AluI arrays

