
Fig. 8.
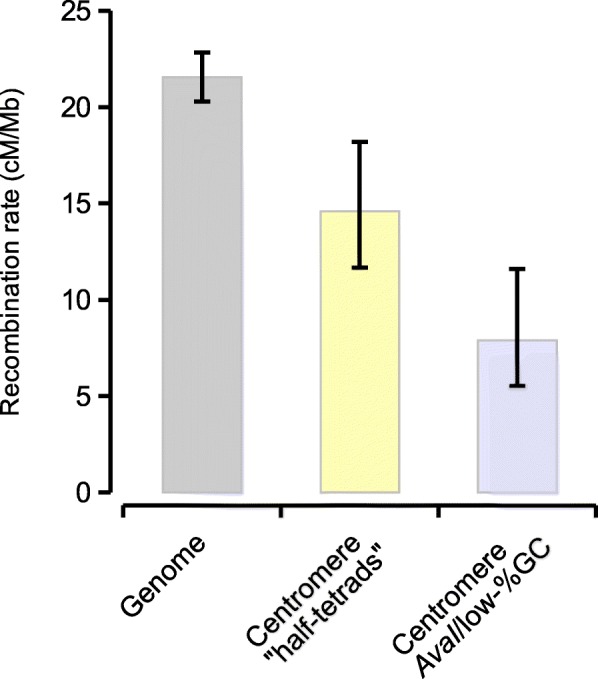
Recombination rates in different genomic regions. Recombination rates were computed from the genetic and physical distances between genetic map markers scattered across the whole genome or located within putative centromere regions. 95% confidence intervals were computed from bootstrapping marker-to-marker pairs (2000 replicates)