Figure 10.
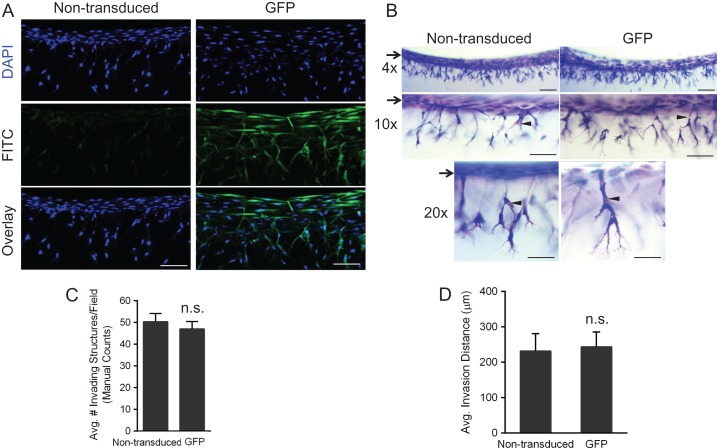
UtMVECs demonstrate comparable invasion responses after lentiviral transduction. UtMVECs were either not transduced (Non-transduced) or transduced with green fluorescent protein lentiviruses (GFP) for 5 days and seeded onto 2.5 mg/ml collagen type I matrices containing 1 μM S1P in the presence of 40 ng/ml VEGF and bFGF and allowed to invade 24 h. (A) Cells were stained with DAPI to label cell nuclei prior to mounting on the side. Z-stacks with 1 μm step-size images of non-transduced and GFP-transduced cells were taken using a Nikon TI A1R inverted confocal microscope at 20× magnification. Note successful overexpression of GFP in GFP-transduced cells. Scale bars = 100 μm. (B) Toluidine blue stained collagen matrices were imaged from the side at 4×, 10× and 20× magnification to demonstrate comparable invasion distance and density in both groups. Scale bars equal 200 μm, 100 μm and 50 μm, respectively. Arrows indicate the original cell monolayer, while the arrowheads point to lumens in invading cells. (C) Invasion density (±SD) of invading cells was quantified manually. Statistical significance of invasion density between non-transduced and GFP-transduced cells was analyzed using a Student’s t-test, finding no significant differences (n.s.) between the groups with P < 0.05 as the limit for significance. (D) Invasion distance was quantified by measuring the distance from the cell monolayer to the tips of invading structures (n > 100 structures per treatment group). Data shown represent average invasion distances (±SD) from a representative experiment (n = 3). Statistical significance of invasion density between non-transduced and GFP-transduced cells was analyzed using a Student’s t-test. No significant differences (n.s.) between the groups were observed with P < 0.05 considered significant.

