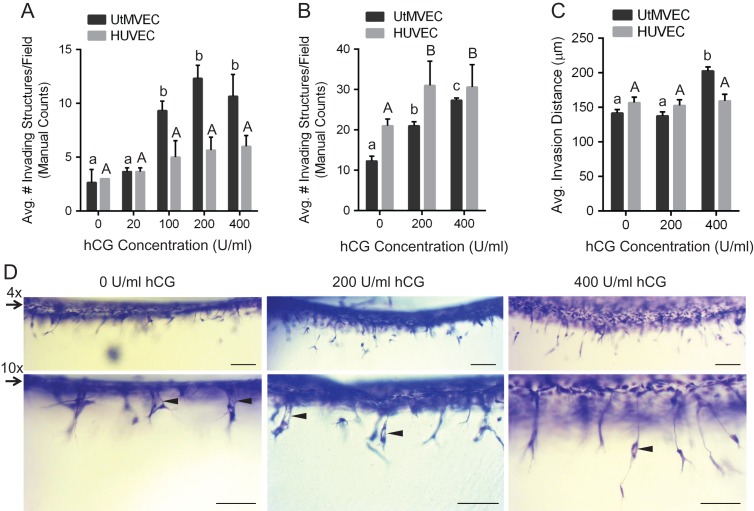
Figure 11.
hCG increases UtMVEC invasion responses in a dose-dependent manner. (A) UtMVECs (Lonza Cat. CC-2564, Lot 2F1740) and HUVECs (Lonza Cat. C2517A, Lot 444770) derived from female donors, were seeded onto 2.5 mg/ml collagen matrices containing 0, 20, 100, 200 or 400 U/ml hCG in the presence of 40 ng/ml VEGF and bFGF. No S1P was added. Cells were allowed to invade for 24 h. Invasion density was quantified manually as the average number of invading cells in a 0.25 mm2 field (±SD). At least three wells were counted and averaged per treatment. Results shown are from a representative experiment (n = 3). Statistical significance was determined using a one-way ANOVA with Tukey’s post hoc test where each letter represents a significant statistical difference at P < 0.05 compared to other letters. Lower and upper case letters compare UtMVECs and HUVECs, respectively. (B) UtMVECs and HUVECs were seeded onto 2.5 mg/ml collagen matrices containing 300 nM S1P and either 0, 200 or 400 U/ml hCG in the presence of 40 ng/ml VEGF and bFGF. Cells were allowed to invade for 24 h. Invasion density (±SD) was quantified manually from three wells. Data from a representative experiment (n = 3) are shown. Statistical significance was determined using a one-way ANOVA with Tukey’s post hoc test, where each letter represents a significant statistical difference at P < 0.05 compared to other letters. Upper and lower case letters compare HUVECs and UtMVECs, respectively. (C) Samples from (B) were used to quantify invasion distance, where n > 100 structures from a single experiment (n = 3) were included per treatment group for the analysis. Data shown represent average invasion distances (±SEM). Statistical significance was determined using a one-way ANOVA with Tukey’s post hoc test where each letter represents a significant statistical difference at P < 0.05 compared to other letters. Upper and lower case letters compare HUVECs and UtMVECs, respectively. (D) Photographs of UtMVEC invasion assays from panel B. Two magnifications are shown at 4× (upper panels) and 10× (lower panels). Scale bars = 200 μm and 100 μm, respectively for upper and lower panels. Arrows indicate the original cell monolayer, while arrowheads point to lumens in invading cells.

