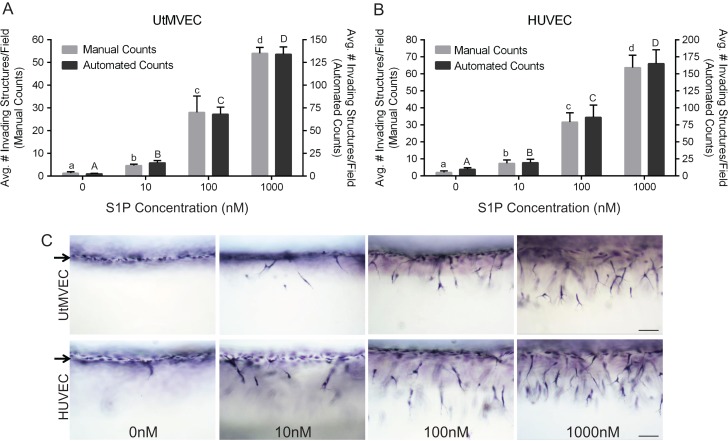
Figure 3.
Sphingosine 1-phosphate and GFs stimulate dose-dependent UtMVEC and HUVEC invasion. (A) UtMVECs and (B) HUVECs were seeded onto 2.5 mg/ml collagen matrices containing 0–1000 nM sphingosine 1-phosphate (S1P) in the presence of 40 ng/ml bFGF and VEGF. Cells were allowed to invade 24 h. Invasion density quantification was performed as described in the Materials and Methods section and is presented on the y-axis of panels (A) and (B), with manual and automated counts depicted to the left and right, respectively. At least six wells were averaged per treatment. Data in both panels show average values (±SD) from a representative experiment of three independent experiments performed. (C) Photographs of UtMVEC and HUVEC invasion responses (side view) at 24 h with indicated concentration of S1P. Scale bars represent 100 μm. Arrows indicate the cell monolayer. Statistical significance in panels (A) and (B) was determined using a one-way ANOVA with Tukey’s post hoc test where each letter represents a significant statistical difference at P < 0.05 compared to all other letters. Lower and upper case letters compare manual and automated counts, respectively.

