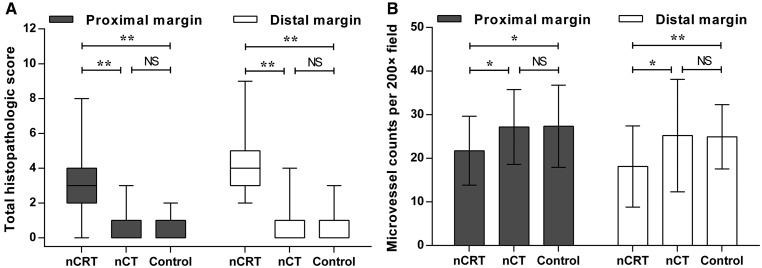
Figure 2.
Total histopathological score (A) and microvessel density (B) for resection margins in three groups after propensity score matching. Score (range) for proximal margin: nCRT, 3 (0–8); nCT, 0 (0–3); control, 0 (0–2). Score for the distal margin: nCRT, 4 (2–9); nCT, 0 (0–4); control, 0 (0–3). Counts for the proximal margin: nCRT, 21.7 ± 7.9, nCT, 27.2 ± 8.6; control, 27.3 ± 9.4. Counts for the distal margin: nCRT, 18.1 ± 9.3; nCT, 25.2 ± 12.9; control, 24.9 ± 7.4. *P < 0.01, **P < 0.001. NS, not significant; nCRT, neoadjuvant chemoradiotherapy; nCT, neoadjuvant chemotherapy.

