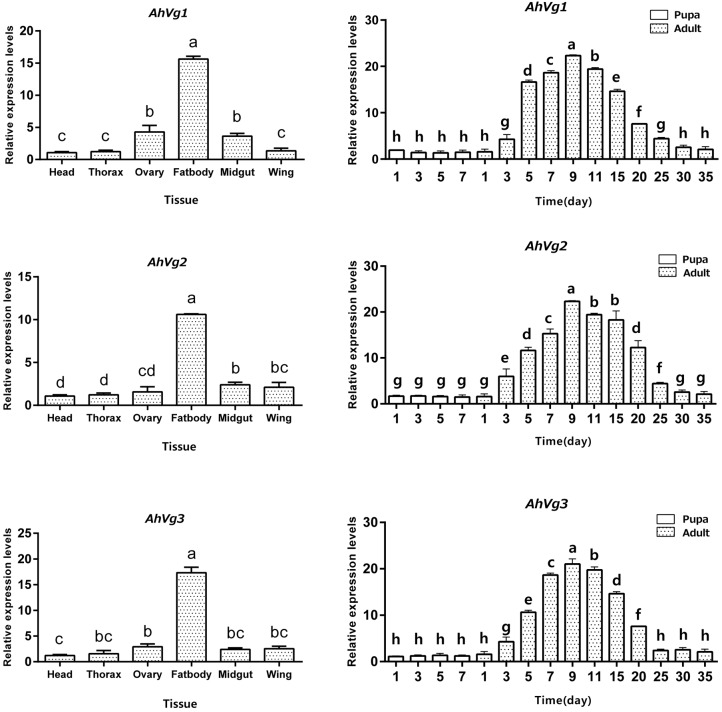
FIGURE 3.
Tissue- and developmental stage-specific expression patterns. The relative mRNA levels were normalized to those of the CoxI gene and analyzed using the 2−ΔΔCT method. All values are shown as the mean ± SD. The data were analyzed by the least significant difference (LSD) test after one-way analysis of variance (ANOVA). Different letters indicate significant differences between means (P < 0.05).

