Figure 6.
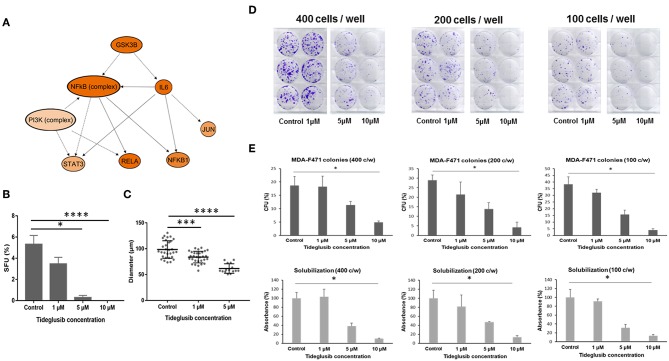
Effect of tideglusib on sphere and colony forming ability of Gprc5a−/− Kras-mutant LUAD cells. (A) Predicted mechanistic gene-gene interaction network mediated by GSK3β as predicted by the in silico pathways analysis. The molecules shown in orange are predicted to be activated. Color intensity represents the level of activation. The solid and interrupted arrows represent direct and indirect interactions, respectively. MDA-F471 cells were cultured in Matrigel™ for 6 to 7 days. Formed spheres were propagated to G2 and treated with control (DMSO), 1, 5, and 10 μM of tideglusib every 2 to 3 days. (B) Sphere forming units (SFUs) were calculated for each condition as percentage of the number of formed spheres relative to number of seeded cells. Data were statistically analyzed by Dunn's post-hoc test following Kruskal-Wallis (for three independent experiments in each group with two technical duplicates in each experiment). (C) Diameters of 30 spheres per condition were measured using Carl Zeiss Zen 2 image software and analyzed by one-way ANOVA. Colony formation assay of adherent MDA-F471 cells was performed as described in the Materials and Methods section (D–E) Cells were seeded in triplicates in three seeding densities (400, 200 and 100 cells/well) in six-well plates and treated with varying concentrations of tideglusib every 2 to 3 days for 7 days. Scanned images of the cultured adherent cells are depicted in (D) Colonies were counted and colony forming units (CFUs) were calculated for each condition as follows: CFU = 100 x (number of colonies/the original seeding density) (E, upper panels). Spectrophotometric analysis of solubilized crystal violet-stained colonies was performed as described in the Methods section (E, lower panels). Differences in number of colonies and absorbance between the different conditions were analyzed using Dunn's post-hoc test following Kruskal-Wallis (*P < 0.05; ***P < 0.001; ****P < 0.0001).

