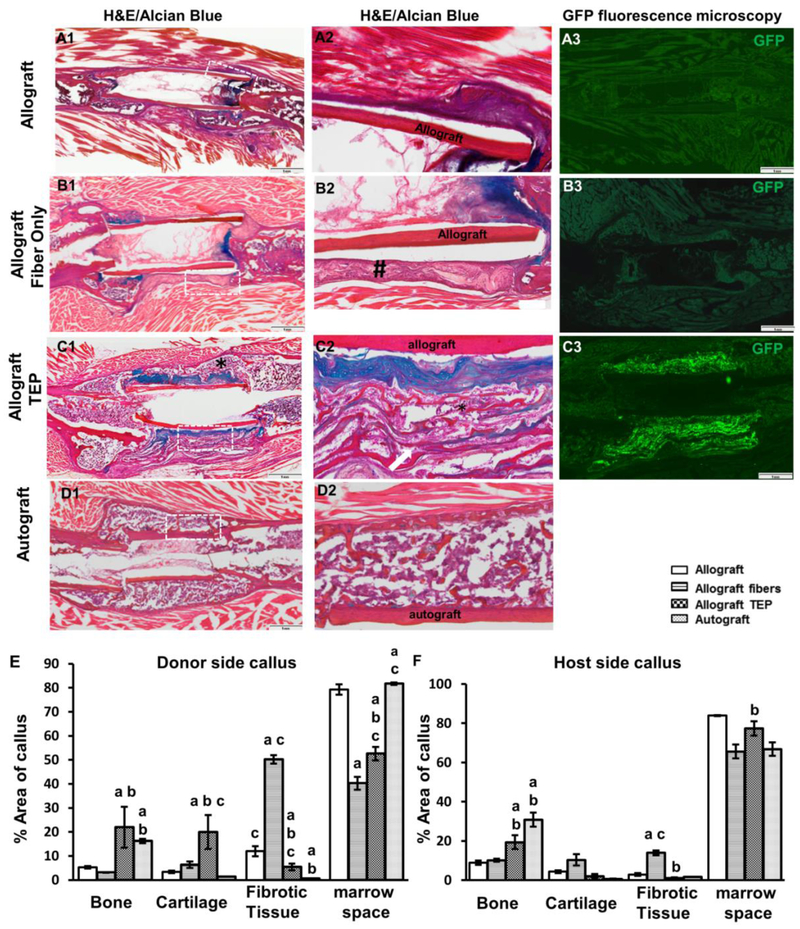
Figure 3. TEP induced donor-dependent bone/cartilage formation in femoral allograft healing.
Histology of Alcian Blue/H&E staining and GFP fluorescence microscopy of allograft (A1-3), allograft with fibers (B1-3), allograft with TEP (C1-3) and autograft (D1-2) at weeks 5 post-surgery. Scale bar=1mm. Boxed regions in A1, B1, C1 and D1 are illustrated in A2, B2, C2 and D2, respectively. Of note is the fibrotic capsule around bone allograft in fiber only group (indicated by # in B2) and the reconstituted bone marrow in TEP treated group (indicated by * in C1 and C2). Quantitative histomorphometric analyses show the percent of bone, cartilage, fibrotic tissue and bone marrow space in donor (E) and host periosteal callus (F). a, p<0.05 versus allograft; b, p<0.05 versus allograft with fibers; c, p<0.05 versus autograft. n=4.

