FIG 1.
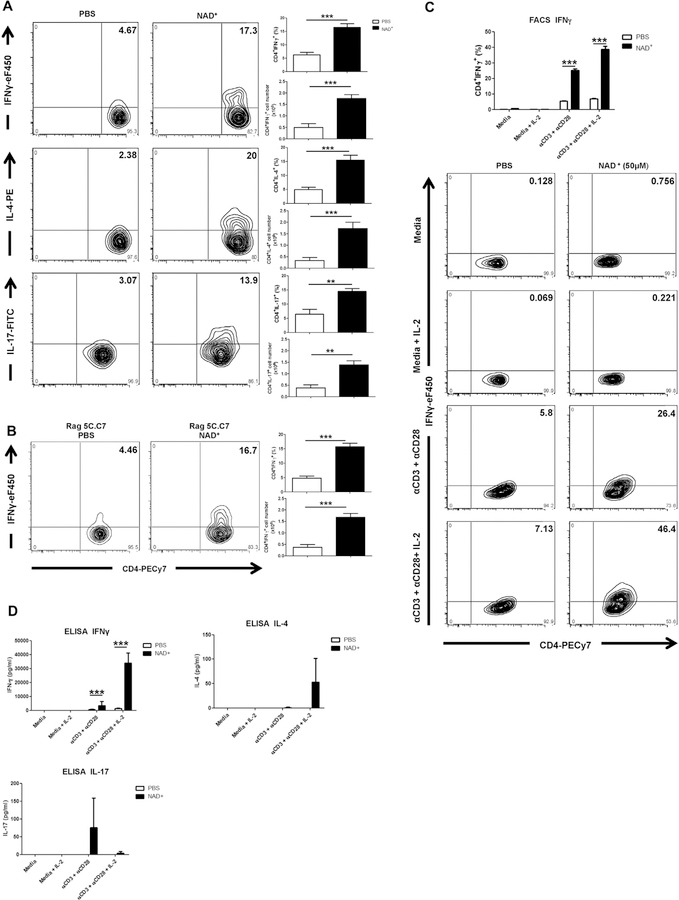
NAD+ induces T-cell activation in vivo and T-cell differentiation in vitro after TCR activation. A, C57BL/6 mice were treated daily with intraperitoneal injection of 40 mg of NAD+ or a placebo solution (PBS). After 7 days, mice were killed, and CD4+ T cells were isolated from spleens. Frequencies and total numbers of CD4+IFN-γ+, CD4+IL-4+, and CD4+IL-17A+ cells were analyzed by using flow cytometry. B, CD4+ T cells (3 × 10⁶) from 5C.C7 RAG-2–deficient mice were injected into Rag2−/− (B10.A background) mice as adoptive transfer recipients. Mice were then treated with NAD+ or PBS for 7 days and subsequently killed to analyze frequencies and total numbers of CD4+IFN-γ+ cells by using flow cytometry. C and D, Sorted naive CD4+CD44−CD62L+ T cells were isolated from spleens of C57BL/6 mice and cultured in complete media alone with α-CD3/α-CD28 with or without IL-2 or in the presence of 50 µmol/L NAD+. After 96 hours, frequencies of CD4+IFN-γ+ cells and IFN-γ, IL-4, and IL-17A cytokine secretion were assessed by using flow cytometry (Fig 1, C) and ELISA (Fig 1, D), respectively. Statistics were as follows: n = 15 (Fig 1, A and B) or n = 10 (Fig 1, C and D). Data were derived from 3 independent sets of experiments. The Student t test and ANOVA were used accordingly to compare groups: **P < .01 and ***P < .001. Data are presented as means ± SDs. FACS, Fluorescein-activated cell sorting; FITC, fluorescein isothiocyanate; PE, phycoerythrin.

