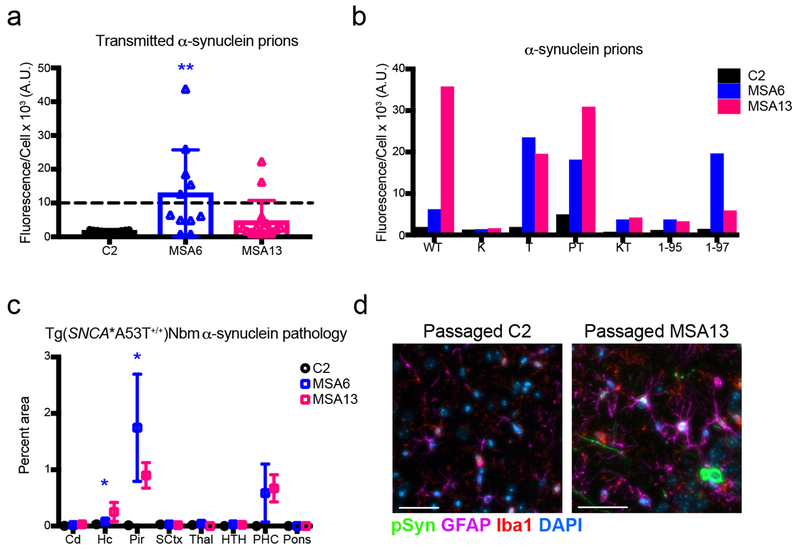
Fig. 8. MSA prions passaged in TgM83+/− mice propagate in Tg(SNCA*A53T+/+)Nbm mice.
Brain homogenates from control (C2) or MSA patient samples (MSA6 or MSA13) first passaged in TgM83+/− mice were used to inoculate Tg(SNCA*A53T+/+)Nbm animals. Mice were collected 300 days post-inoculation. (a) Frozen half-brains were homogenized and assessed for the presence of α-synuclein prions using the α-syn140*A53T–YFP cell assay (× 103 A.U.). Passaged C2 homogenate did not induce α-synuclein prion formation, but seven mice inoculated with either passaged MSA6 or MSA13 patient samples propagated α-synuclein prions. (b) Alpha-synuclein prions in the Tg(SNCA*A53T+/+)Nbm mice were analyzed for infectivity in additional α-syn–YFP cell lines. Samples infected cells expressing wild-type (WT) and mutant α-synuclein (A53T – T; A30P,A53T – PT; and A53T truncated at residue 97 – 1-97), but they did not infect cells expressing the E46K mutation alone (K) or in combination with the A53T mutation (KT). Additionally, they did not infect A53T-expressing cells truncated at residue 95 (1-95). Homogenates from mice inoculated with passaged C2 patient sample did not infect any of the cells. (c,d) Fixed half-brains from the same mice were analyzed for phosphorylated α-synuclein neuropathology in the caudoputamen (Cd), hippocampus and fimbria (Hc), piriform cortex and amygdala (Pir), sensory cortex (SCtx), thalamus (Thal), hypothalamus (HTH), parahippocampal cortex (PHC), and pons. Mice inoculated with passaged C2 patient sample (n=11) did not develop α-synuclein aggregates, whereas inoculation of mouse-passaged MSA samples (MSA6: n=5; MSA13: n=2) induced α-synuclein accumulation in the Pir and PHC. Quantification performed using one slide containing all analyzed brain regions per animal (c). Representative images (d) show that the passaged MSA patient samples induced α-synuclein inclusions (green) that co-localized with astrocytes (GFAP; purple) and reactive microglia (Iba1; red). DAPI in blue. Scale bar, 50 μm. * = P < 0.01; ** = P < 0.01.

