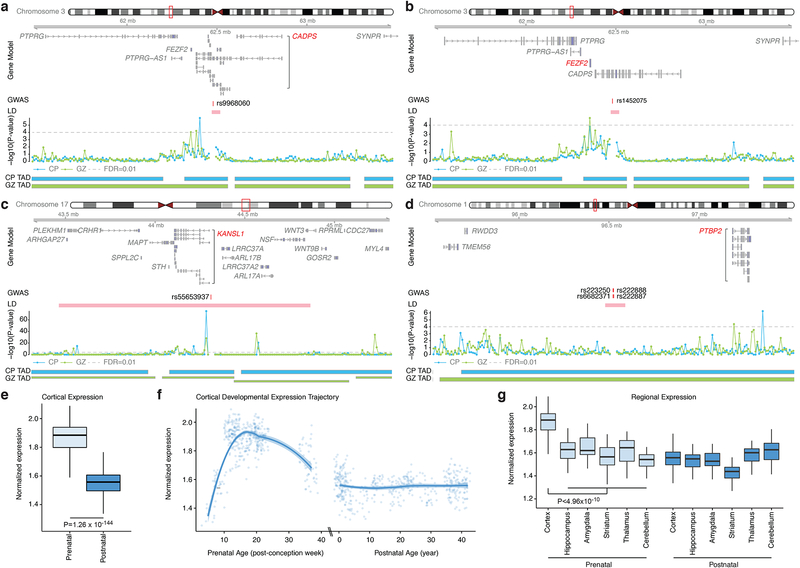
Figure 5. Chromatin interactions identify putative target genes of ASD loci.
a-d. Chromatin interaction maps of credible SNPs to the 1 Mb flanking region, providing putative candidate genes that physically interact with credible SNPs. Gene Model is based on Gencode v19 and putative target genes are marked in red; Genomic coordinate for a credible SNP is labeled as GWAS; −log10(P-value), significance of the interaction between a SNP and each 10-kb bin, grey dotted line for FDR = 0.01 (one-sided significance test calculated as the probability of observing a higher contact frequency under the fitted Weibull distribution matched by chromosome and distance); Topologically associated domain (TAD) borders in cortical plate (CP) and germinal zone (GZ). e-f. Developmental expression trajectories of ASD candidate genes show highest expression in prenatal periods. Significance by t-test (N = 410 and 453 for prenatal and postnatal samples, respectively). Box-plots showing median, interquartile range (IQR) with whiskers adding IQR to the 1st and 3rd quartile (e and g). LOESS smooth curve plotted with actual data points (f) g. ASD candidate genes are highly expressed in the developing cortex as compared to other brain regions. One-way ANOVA and posthoc Tukey test, FDR-corrected. (N = 410/453, 39/36, 33/37, 48/34, 37/36, 32/39 for prenatal/postnatal cortex, hippocampus, amygdala, striatum, thalamus, and cerebellum, respectively).

