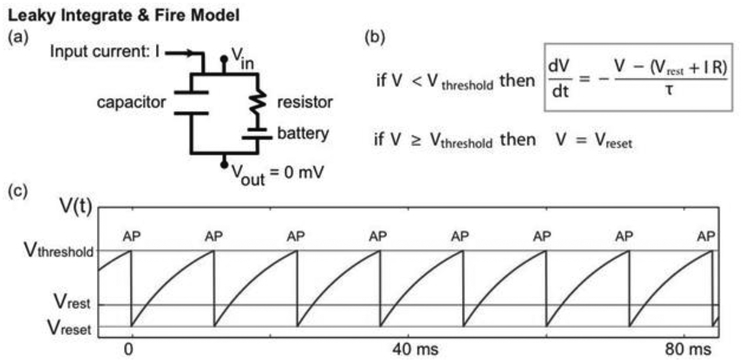
Figure 3.
(a) The LIF model is motivated by an equivalent circuit. The capacitor represents the cell membrane through which ions cannot pass. The resistor represents channels in the membrane (through which ions can pass) and the battery a difference in ion concentration across the membrane. (b) The equivalent circuit motivates the differential equation that describes voltage dynamics (gray box). When the voltage reaches a threshold value (Vthreshold), it is reset to a smaller value (Vreset). In this model, the occurrence of a reset indicates an action potential; the rapid voltage dynamics of action potentials are not included in the model. (c) An example trace of the LIF model voltage (blue). When the input current (I) is large enough, the voltage increases until reaching the voltage threshold (red horizontal line), at which time the voltage is set to the reset voltage (green horizontal line). The times of reset are labeled as “AP”, denoting action potential. In the absence of an applied current (I = 0) the voltage approaches a stable equilibrium value (Vrest).

