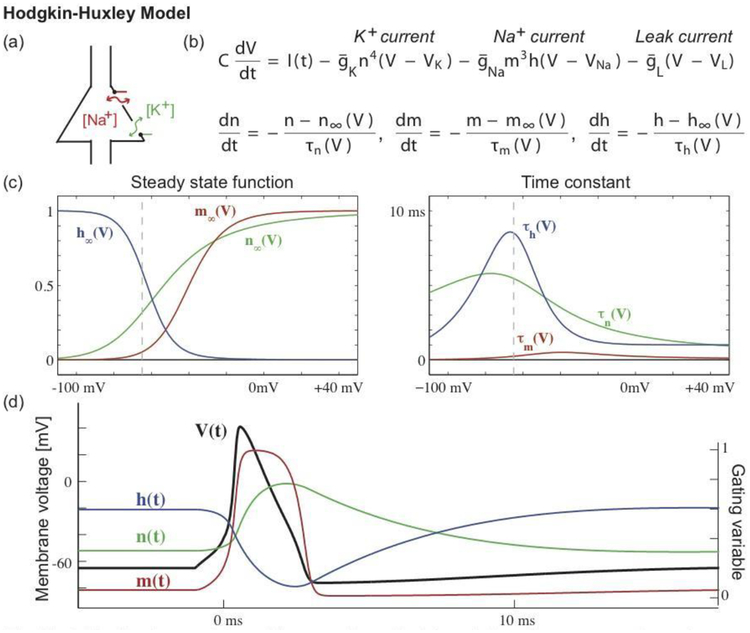
Figure 4.
The Hodgkin-Huxley model provides a mathematical description of a neuron’s voltage dynamics in terms of changes in sodium (Na+) and potassium (K+) ion concentrations. The cartoon in (a) illustrates a cell body with membrane channels through which (Na+) and (K+) may pass. The model consists of four coupled nonlinear differential equations (b) that describe the voltage dynamics (V), which vary according to an input current (I), a potassium current, a sodium current, and a leak current. The conductances of the potassium (n) and sodium currents (m, h) vary in time, which controls the flow of sodium and potassium ions through the neural membrane. Each channel’s dynamics depends on (c) a steady state function and a time constant. The steady state functions range from 0 to 1, where 0 indicates that the channel is closed (so that ions cannot pass), and 1 indicates that the channel is open (ions can pass). One might visualize these channels as gates that swing open and closed, allowing ions to pass or impeding their flow; these gates are indicated in green and red in the cartoon (a). The steady state functions depend on the voltage; the vertical dashed line indicates the typical resting voltage value of a neuron. The time constants are less than 10 ms, and smallest for one component of the sodium channel (the sodium activation gate m). (d) During an action potential, the voltage undergoes a rapid depolarization (V increases) and then less rapid hyperpolarization (V decreases), supported by the opening and closing of the membrane channels.

