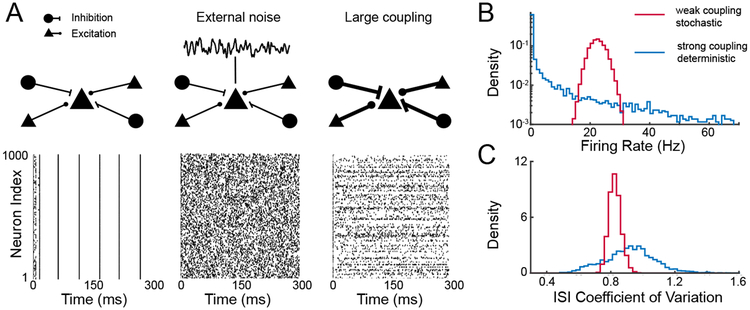
Figure 6.
Panel A displays plots of spike trains from 1000 excitatory neurons in a network having 1000 excitatory and 1000 inhibitory LIF neurons with connections determined from independent Bernoulli random variables having success probability of 0.2; on average K = 200 inputs per neuron with no synaptic dynamics. Each neuron receives a static depolarizing input; in absence of coupling each neuron fires repetitively. Left: Spike trains under weak coupling, current J ∝ K−1. Middle: Spike trains under weak couplng, with additional uncorrelated noise applied to each cell. Right: Spike trains under strong coupling, . Panel B shows the distribution of firing rates across cells, and panel C the distribution of interspike interval (ISI) coefficient of variation across cells.

