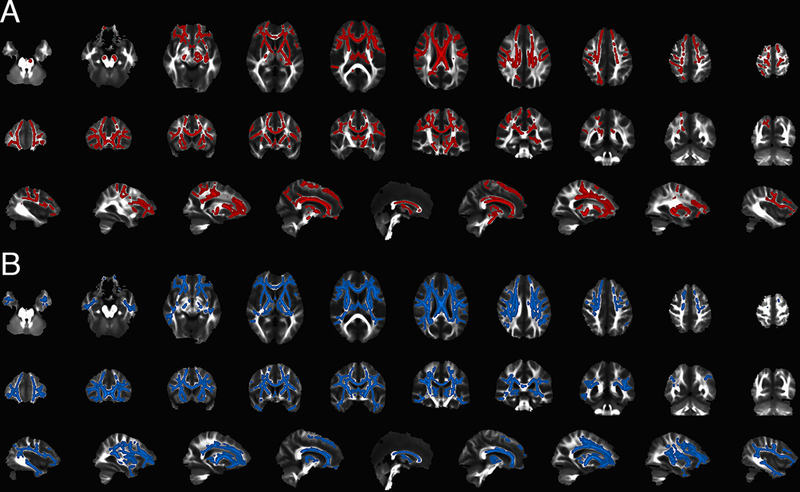
Figure 1.

Distribution of white matter alterations in subjects with C9orf72 mutations by whole-brain analysis (TBSS, p <0.001, FWE correction). White matter regions that differ between twenty-eight healthy controls and twenty-eight C9+ subjects are more pronounced frontally, with relative sparing of splenium and occipital white matter. A) Areas with reduced fractional anisotropy (FA) in C9+ subjects are shown in red in axial (top row), coronal (middle row) and sagittal (bottom row) views. B) Areas with increased mean diffusivity (MD) are shown in blue in axial (top row), coronal (middle row) and sagittal (bottom row) views. Images shown with right brain on the left side.
