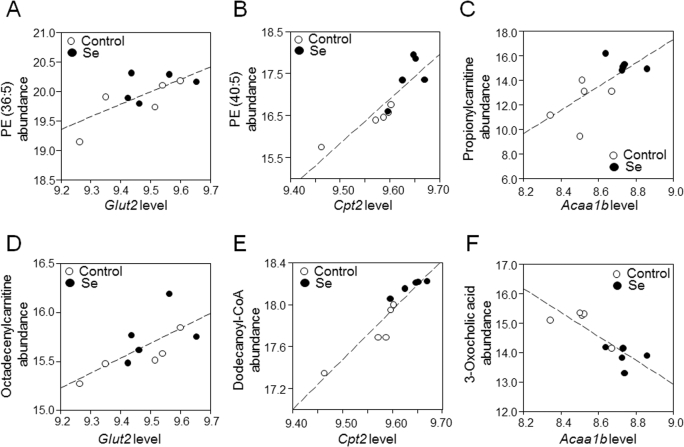
FIGURE 4.
Correlations of selected metabolites with central genes (Glut2, Cpt2, and Acaa1b) in the major transcriptome-metabolome hubs (from Figure 3). (A) PE (36:5): m/z 738.5082, retention time 579 s (ρ = 0.72, P = 0.02); (B) PE (40:5): m/z 794.5710, retention time 582 s, confirmed by MS/MS (ρ = 0.88, P < 0.01); (C) propionylcarnitine: m/z 218.1274, retention time 45 s, confirmed by MS/MS (ρ = 0.71, P = 0.02); (D) octadecenylcarnitine: m/z 426.3561, time 563 s, confirmed by MS/MS (ρ = 0.67, P = 0.03); (E) dodecanoyl-CoA: m/z: 950.2873, retention time 38 s (ρ = 0.94, P < 0.01); (F) 3-oxocholic acid, m/z 407.2790, retention time 436 s (ρ = -0.84, P < 0.01). Values for the transcripts represent RMA average expression levels, and values for the metabolites represent log2 transformed, quantile-normalized mass spectral intensities; fold-changes for nontransformed values are provided in Supplemental Table 4. Acaa1b, peroxisomal 3-oxoacyl-CoA thiolase B; Cpt2, carnitine palmitoyltransferase 2; Glut2, glucose transporter 2; PE, phosphatidylethanolamine; RMA, robust multiarray average.

