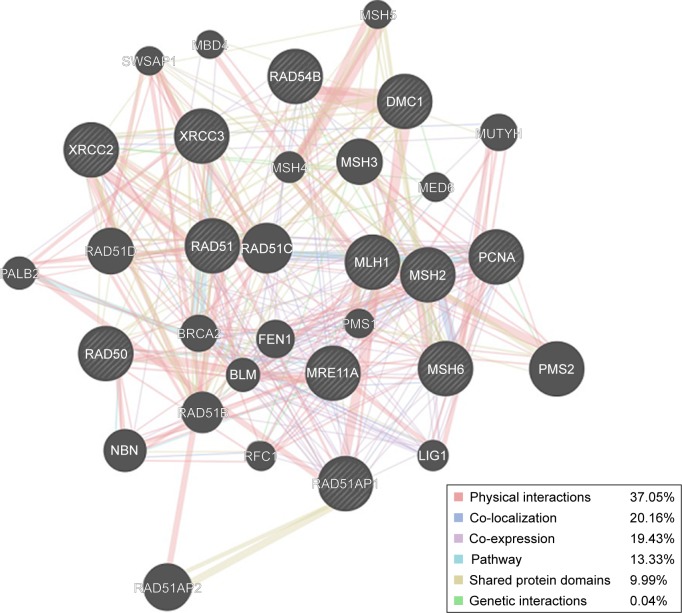
Figure 2.
Protein network of geraniol. Black nodes represent target proteins, and connecting colors indicate different correlations. Functional associations between targets were investigated using GeneMANIA. Genes in black circles were query terms while these in gray circle indicate genes associated with query genes.

