Figure 3.
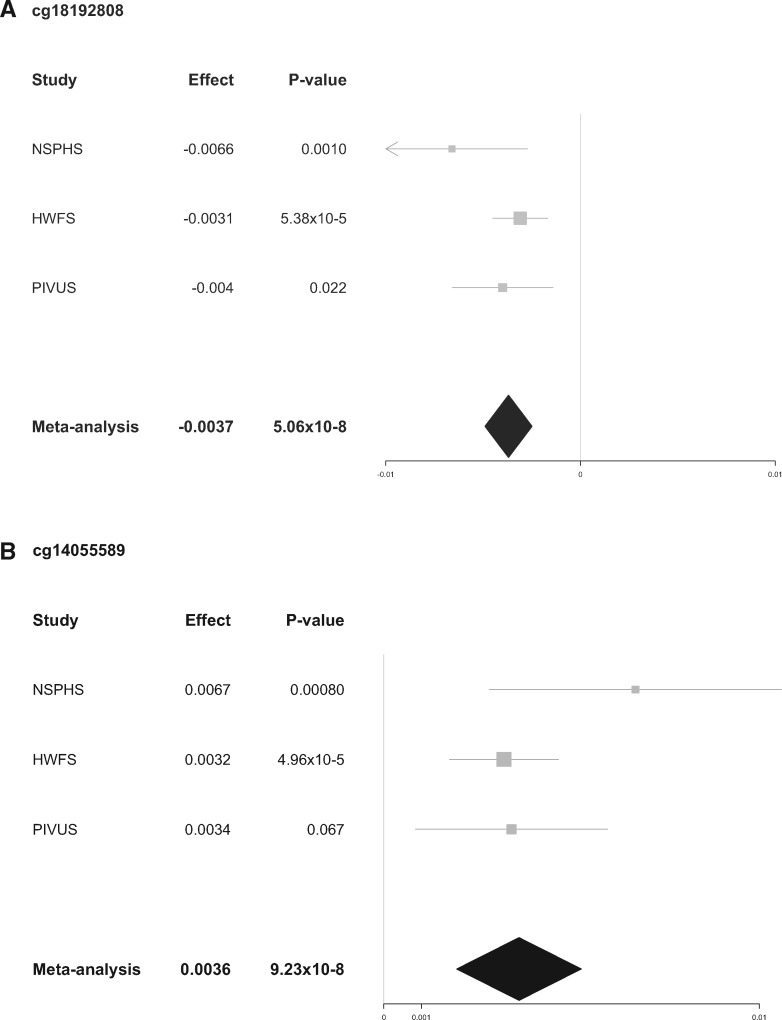
Forest plot of the association between DNA methylation and tea consumption in females. Shown are the effect (95% CI) and P-values for each individual cohort as well as the meta-analysis. (A) cg18192808 was nominally significant with the same direction of effect in all included cohorts, NSPHS, HWFS and PIVUS, and significant at Bonferroni adjusted threshold in the meta-analysis (P < 1.19 × 10⁻⁷). (B) cg14055589 was nominally significant with the same direction of effect in NSPHS and HWFS, but not significant in PIVUS.

