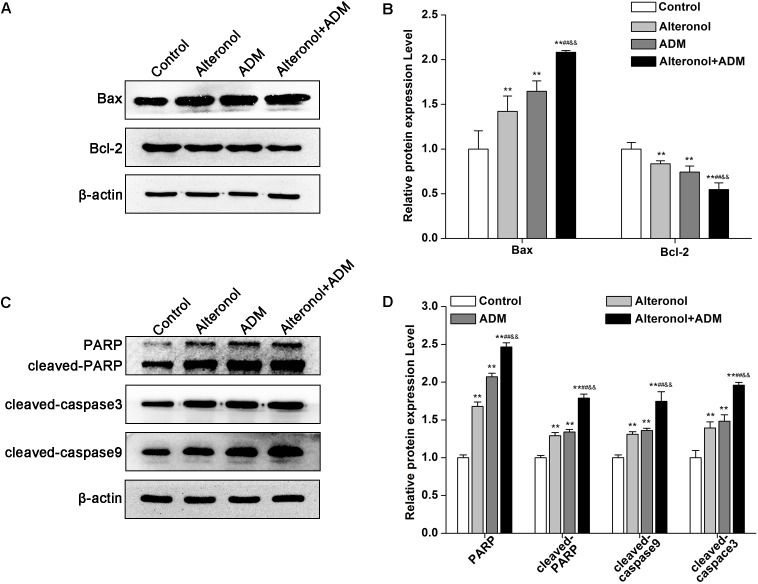
FIGURE 5.
The effect of the combination of alteronol and ADM on protein levels of apoptosis-related molecules in 4T1 cells. (A) The protein levels of Bax and Bcl-2 were measured by western blot. (B) Quantitative analysis of Bax and Bcl-2 protein levels in 4T1 cells after treatment with alteronol and/or ADM. (C) The protein levels of cleaved PARP, cleaved caspase-9, and cleaved caspase-3 were examined by western blot. (D) Quantitative analysis of cleaved PARP, cleaved caspase-9, and cleaved caspase-3 protein levels after the indicated treatments. ∗P < 0.05, ∗∗P < 0.01 vs. control group. #P < 0.05, ##P < 0.01 vs. alteronol group. &P < 0.05, &&P < 0.01 vs. ADM group. All data are expressed as mean ± SD of three independent experiments.

