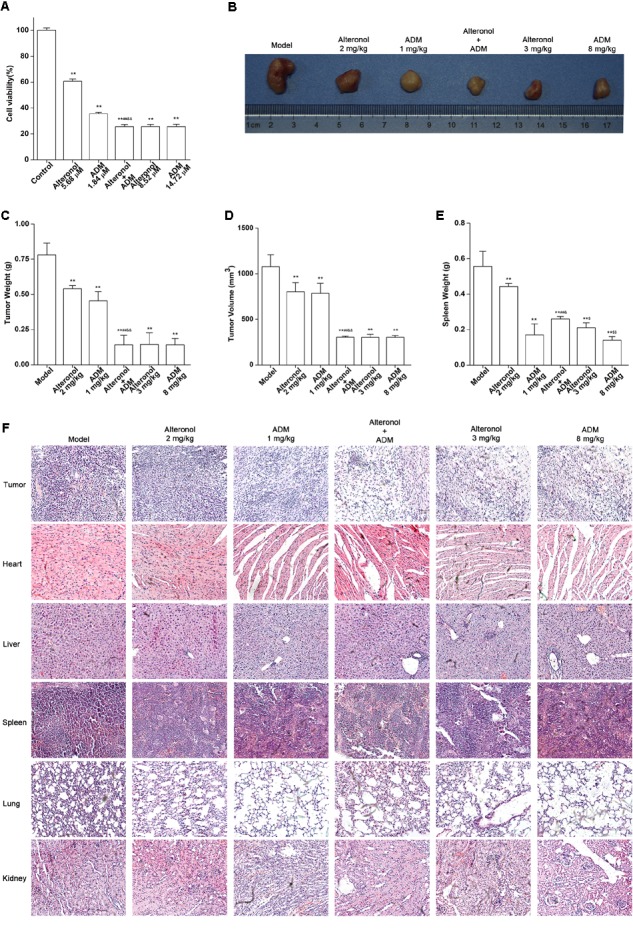
FIGURE 8.

The anti-tumor effect of the combination of alteronol and ADM in vivo. (A) The cell viability was measured by MTT assay after treatment with different doses of alteronol (5.68 and 8.52 μM) and/or ADM (1.84 and 14.72 μM) for 48 h. (B) Microscopic view of tumor tissue in mice. (C) The tumor weights isolated from breast cancer 4T1 cell bearing mice after the indicated treatments for 2 weeks. (D) Isolated tumor volumes from the tumor bearing mice. (E) Isolated spleen weight from breast cancer 4T1 cell bearing model. (F) Histological assessments of tissues using HE staining after treatment with alteronol, ADM, or both. ∗P < 0.05, ∗∗P < 0.01 vs. model group. #P < 0.05, ##P < 0.01 vs. alteronol group (2 mg/kg). &P < 0.05, &&P < 0.01 vs. ADM group (1 mg/kg). $P < 0.05, $$P < 0.01 vs. the low-dose combination group.
