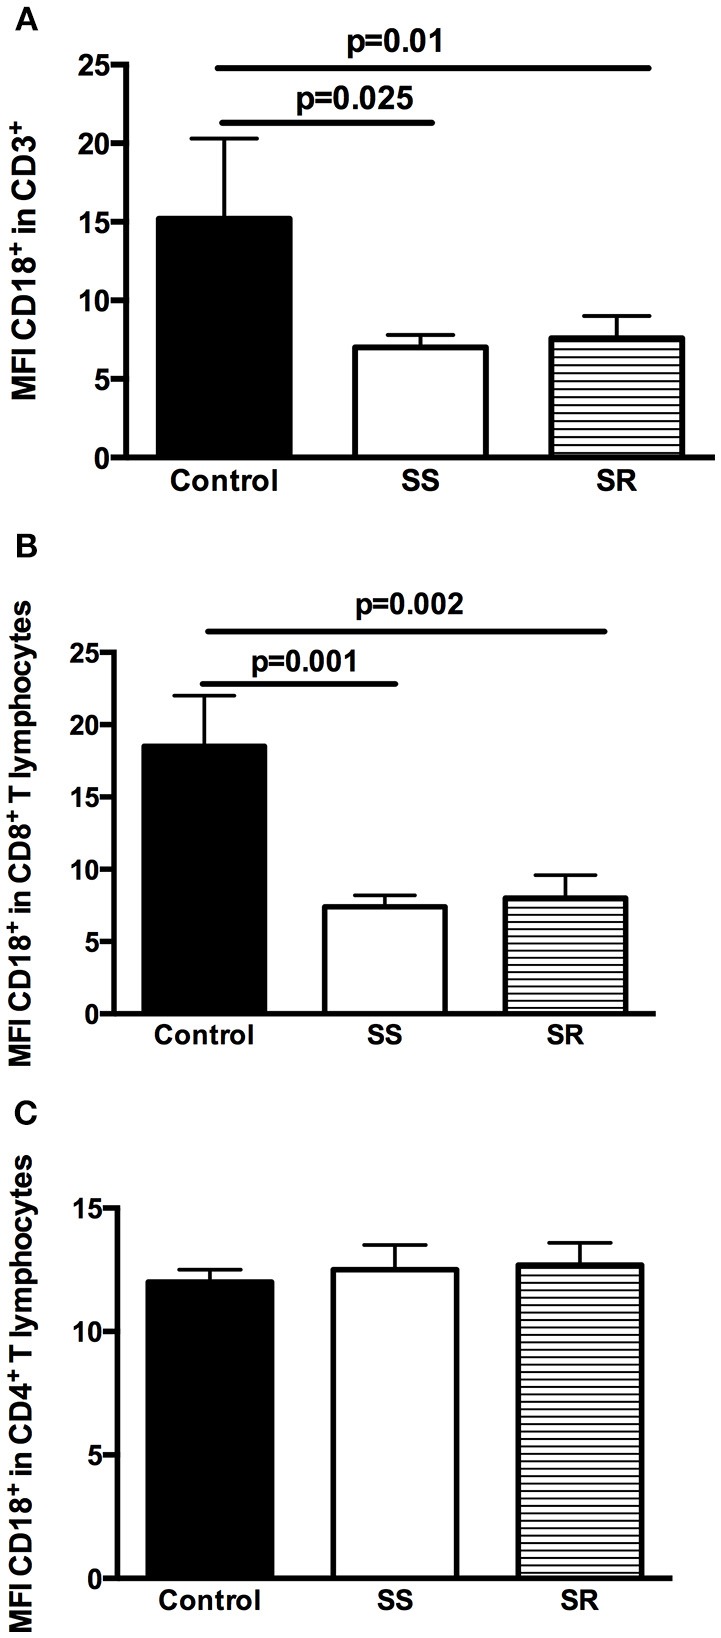
Figure 3.

Analysis of the expression of CD18 on T lymphocytes and subpopulations in peripheral blood lymphocytes of health controls and children with INS steroid-sensitive (SS) and steroid-resistant (SR): (A) CD3+CD18+ lymphocytes; (B) CD3+CD8+CD18+ lymphocytes; (C) CD3+CD4+CD18+ lymphocytes. Results are expressed as bar graphs with mean values and standard deviation. P-values are displayed above lines that indicate each comparison.
