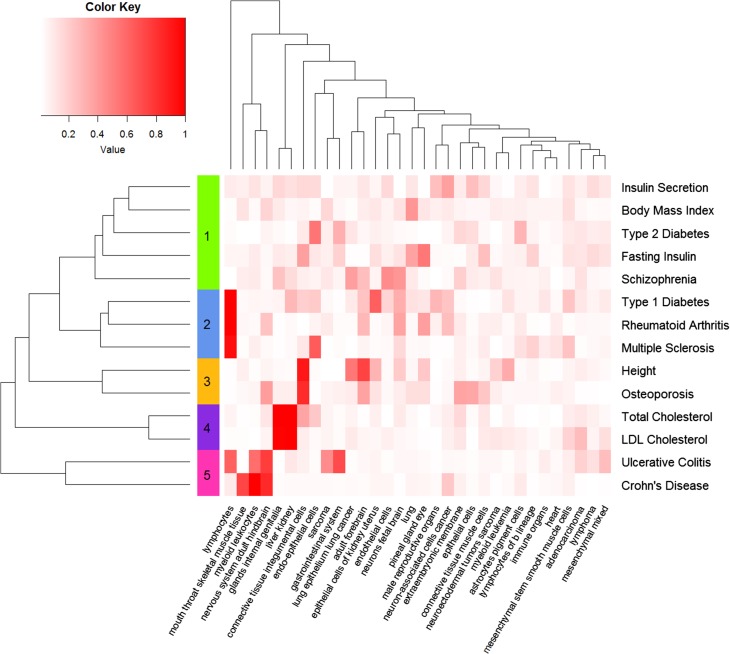
Figure 4.
Cluster analysis of the 14 complex traits by their PIPs across the 32 tissues. Each column denotes a tissue, and each row represents the vector of PIPs across the 32 tissues for a complex trait. The from-white-to-red color represents the value of PIP from low to high. Hierarchical clustering is performed by the vector of PIPs across the 32 tissues, resulting in five clusters.

