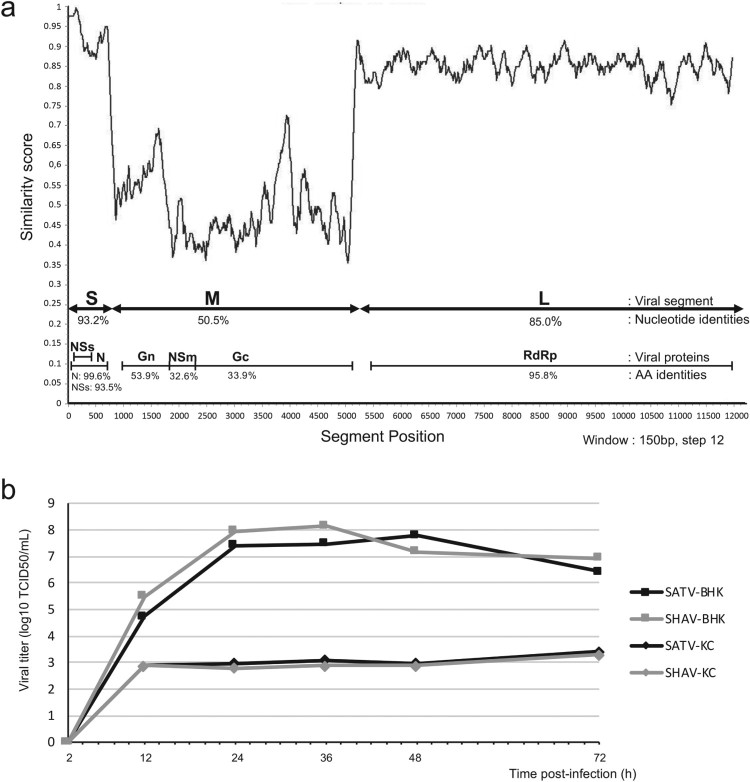
Figure 2.
Comparison of the sequences and growth kinetics of the two Simbuviruses SHAV and SATV. (a) Similarity plot based on the aligned genome sequences of SHAV and SATV. The plot was performed using the Recombination Analysis Tool (RAT) [48]. Segments S, M and L are indicated by double arrows and encoded proteins are illustrated below. Percentage of nucleotide and protein identity for each segment and each encoded protein are annotated. (b) Growth kinetics of the two viruses SHAV and SATV in mammalian and in insect cells. Titers, expressed in TCID50/mL, were determined after 2, 12, 24, 36, 48 and 72 h post infection at MOI 0.01. SATV growth kinetics are illustrated by black lines and SHAV growth kinetics are indicated by grey lines. Growth curves were tested in BHK-21 cells (square lines) or in insect KC cells (diamond lines).

