Figure 4.
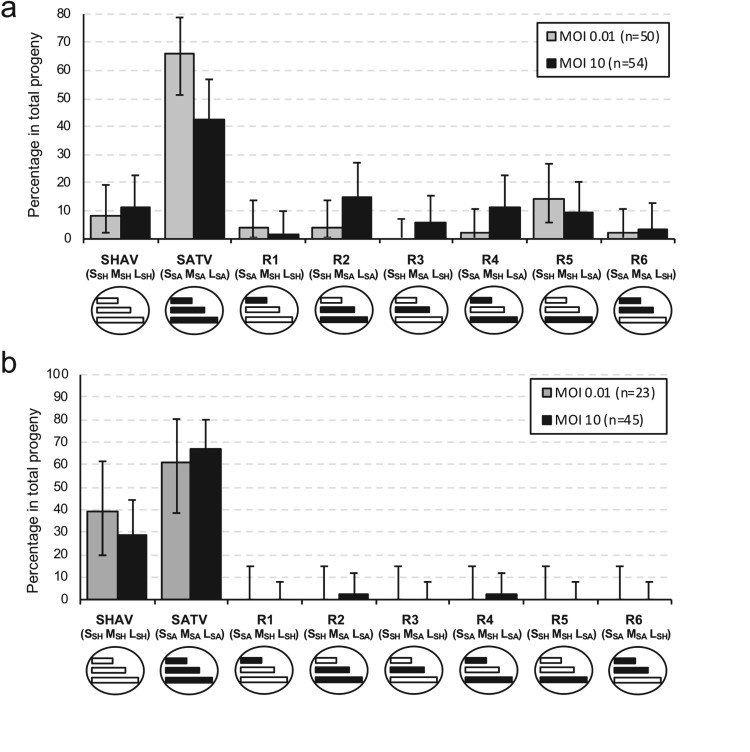
Distribution of progeny viruses obtained after co-infection experiment in BHK-21 mammalian (a) and insect (b) cells (passage 0). Gray boxes represent frequency of progeny viruses obtained after co-infection at MOI 0.01 and black boxes represent frequency of progeny viruses obtained after co-infection at MOI 10. Parental and reassortant viruses and theirs respective genotypes (S, M, L) are indicated below each box and are illustrated by schematic viruses with coloured segments (white for SHAV segment and black for SATV segment). Error bars represent the confidence intervals of each virus frequency (α = 0.05).

