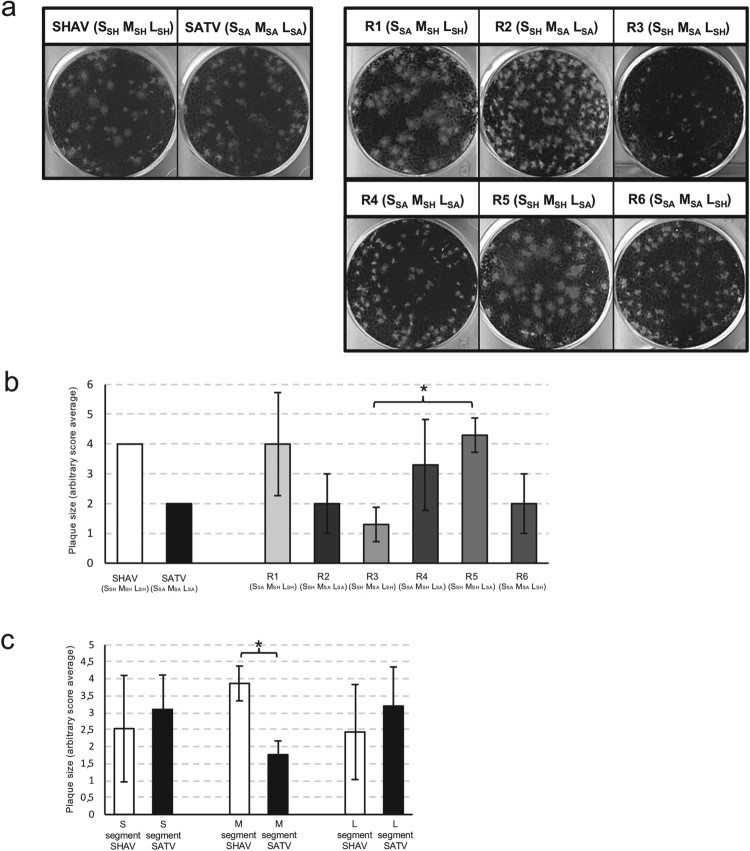
Figure 6.
Plaque size assays of parental and reassortant viruses. (a) Examples of plaques obtained after infection of BHK-21 cells with dilutions of SHAV, SATV and the six different combinations of reassortants (R1 to R6). (b) Schematic representation of plaque size induced by the parental or the reassortant viruses. Plaque size value of the parental strains SHAV and SATV were fixed at 4 and 2 respectively. Error bars represent standard deviation calculated by using three different sets of viruses. An ANOVA test was performed to compare the six reassortants together. A Tukey test was performed to compare each reassortant against every other reassortant. * represents significant difference with P < .05. (c) Comparison of the average plaque sizes induced by the different reassortant viruses according to the parental origin of each segment. Error bars represent standard deviation calculated by using three different viruses harbouring this segment. * represents significant difference with P < .05 by using Welch’s t-test.

