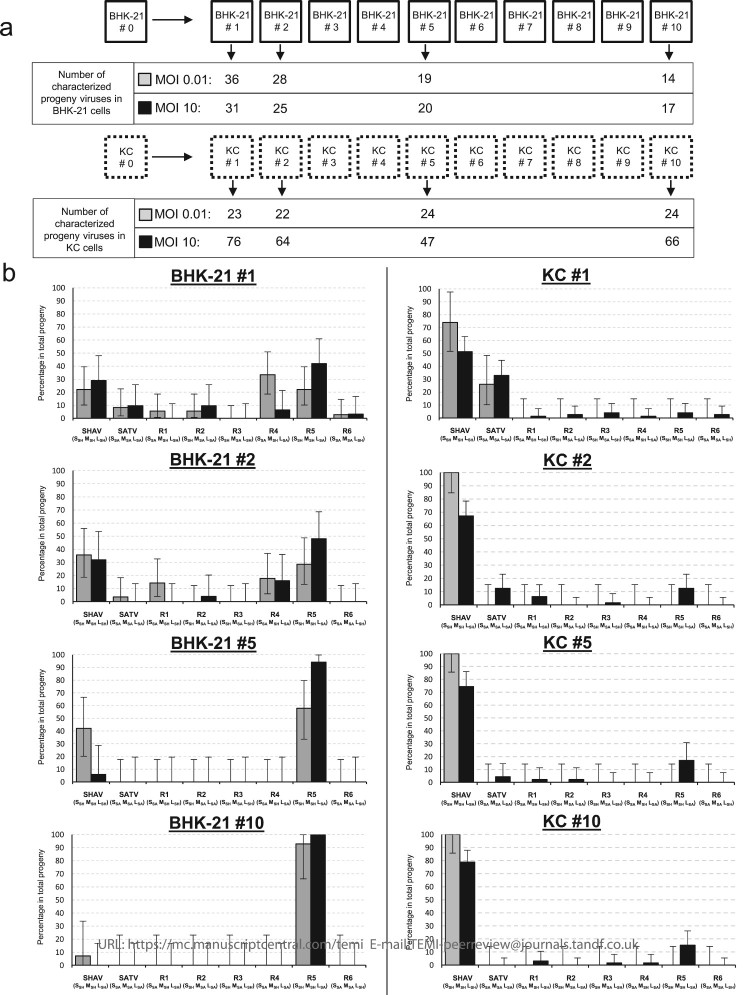
Figure 8.
Dynamics of reassortment observed during 10 successive infections in mammalian or in insect cells. (a) Schematic representation of the competition assay where the initial viral populations were propagated in insect or in mammalian cells during 10 passages. The number of characterized progeny viruses for each tested MOI are indicated for each analysed passage (#1, #2, #5 and #10). (b) Representation of the viral population identified in the two BHK-21 (left panel) and KC (right panel) cell lines and for the two tested MOI: 0.01 (grey boxes) and 10 (black boxes). Parental and reassortant viruses and their respective genotypes (S, M, L) are indicated below each box. Error bars represent the confidence intervals of each virus frequency (α = 0.05).

