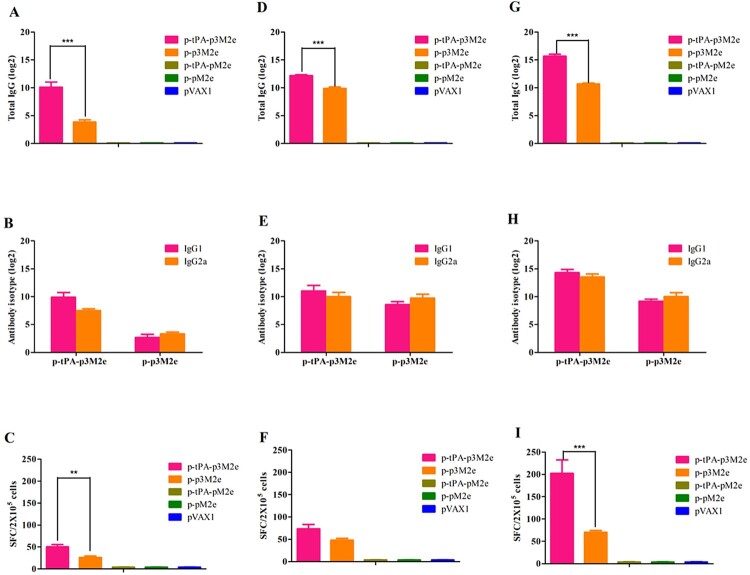
Figure 3.
M2e-specific humoral and cellular immune responses. M2e-specific IgG, IgG1, and IgG2a titers were determined by ELISA. Cellular immune response induced by M2e-immunized mice detected by ELISpot. Data are expressed as spot-forming cells (SFCs) responding to peptide-specific IFN-γ secretion and are presented as the means ± standard deviation. [A, B, C (once immunization), D, E, F (twice immunization) and G, H, I (three times immunization)]. Statistical significance was defined as ***p < 0.001, **p < 0.01.

