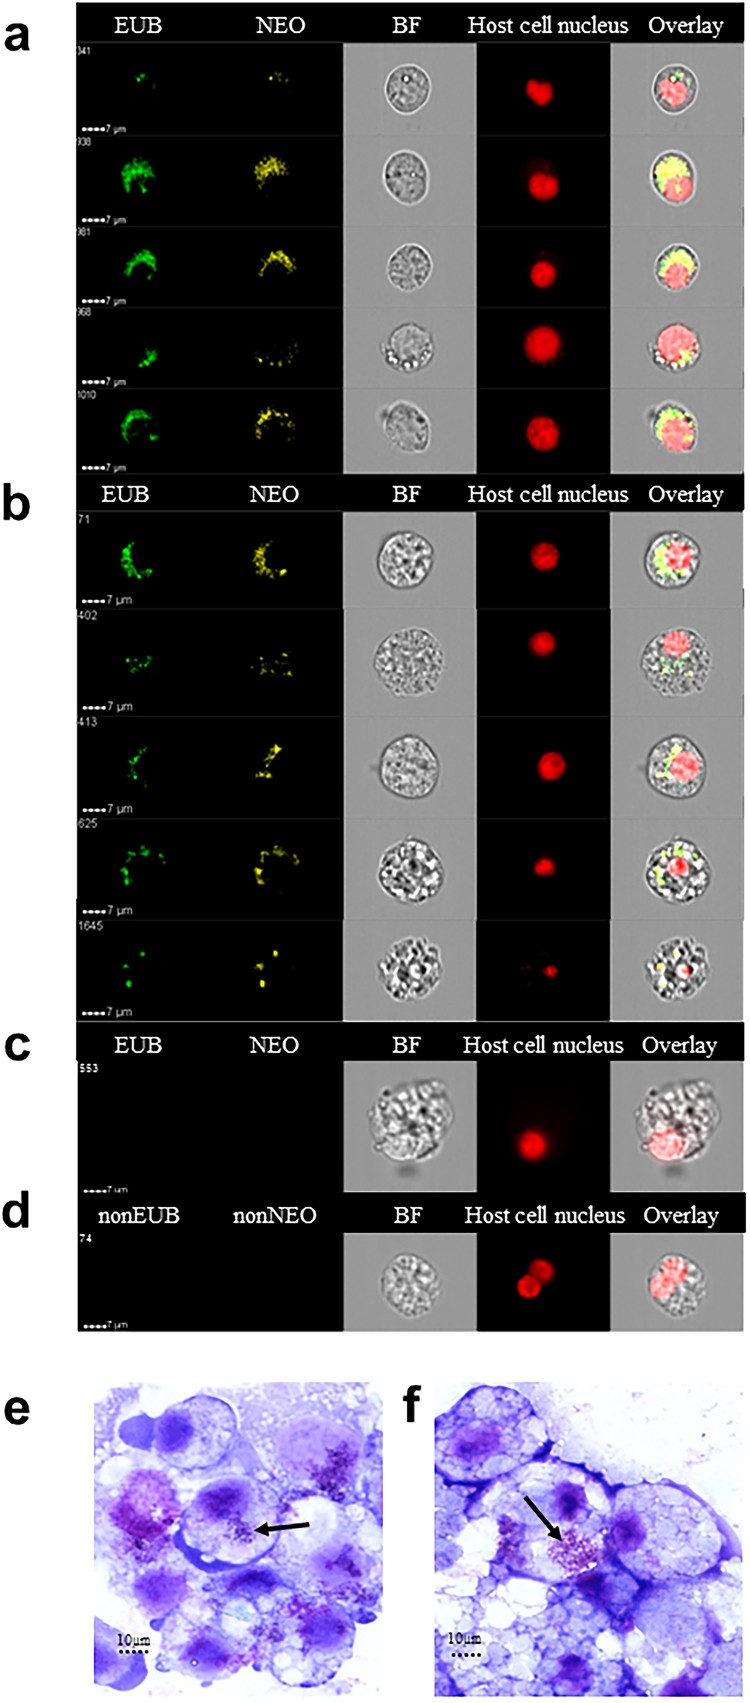
Figure 2.
Visualization of Ca. N. mikurensis infection of tick cell lines. (a) Image flow cytometer depiction of I. scapularis ISE6 cells 9 weeks after the first passage of the infection, which originally had been maintained for 25 weeks of culture after inoculation with an infected blood sample (SE15). The cells were labelled using a panbacterial DNA probe (EUB) in green and a Ca. N. mikurensis-specific DNA probe (NEO) in yellow; bright field image (BF); red staining (DRAQ5) of the host cell nucleus (tick). Overlay image of all stains shows complete congruence of bacteria in the cytoplasm labelled using the panbacterial and Ca. N. mikurensis probes. (b) Panels as in (a) using I. ricinus IRE/CTVM20 cells inoculated with infected blood from patient SE15. (c) Mock-infected IRE/CTVM20 cells stained using the Ca. N. mikurensis-specific DNA probe (NEO), the panbacterial DNA probe (EUB) and host cell nucleus stain DRAQ5. (d) No hybridization signal was seen when infected IRE/CTVM20 cells were incubated with the control probes non-EUB338 or non-Neo. (e)–(f) Giemsa-stained cytocentrifuge smears of tick cells infected in vitro with Ca. N. mikurensis. (e) I. scapularis ISE6 cell line. (f) I. ricinus IRE/CTVM20 cell line. Arrows indicate bacterial inclusions.

