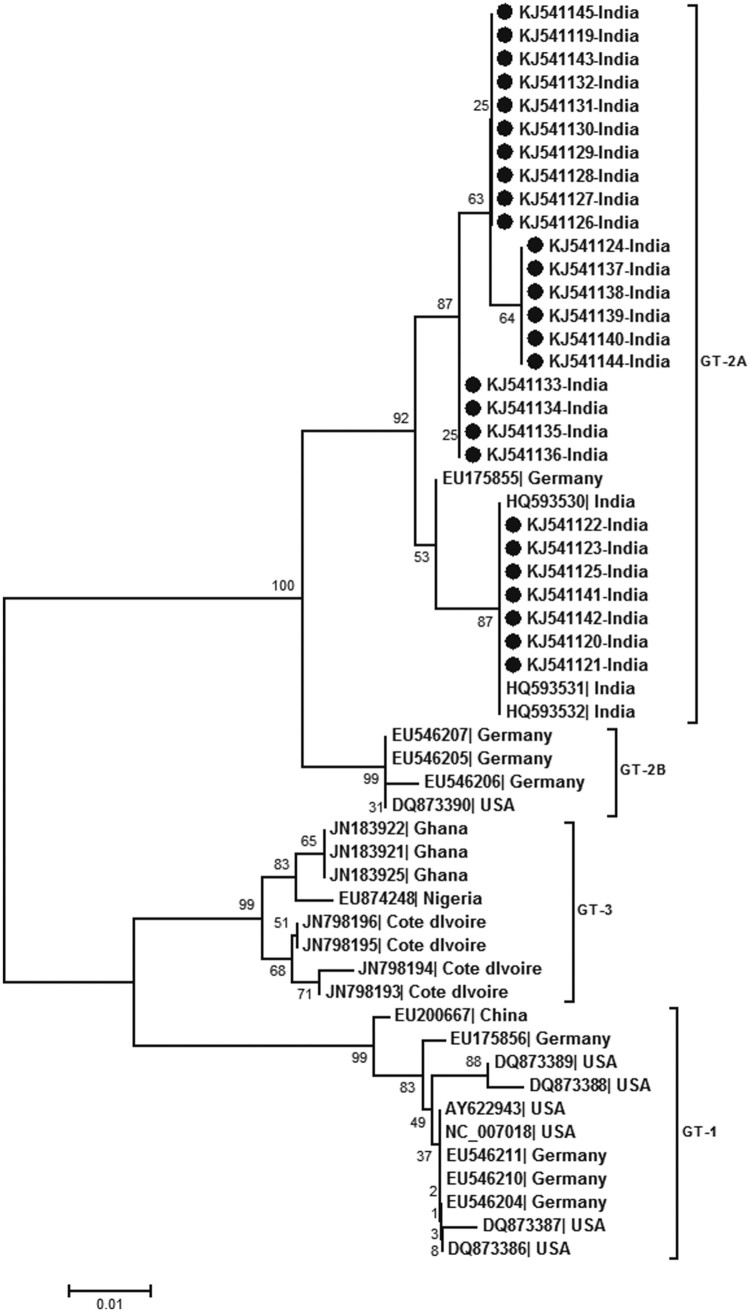
Figure 2.
Phylogenetic analysis of partial NS1 region (256 bp) sequenced during this study (accession numbers KJ541119 to KJ541145). The other sequences used for analysis are denoted by the respective genbank accession numbers. Percent bootstrap support is indicated at each node. Genotypes are designated as brackets. Solid circles reperesent sequences obtained during the present study. Scale bar indicates nucleotide substitutions/site.

