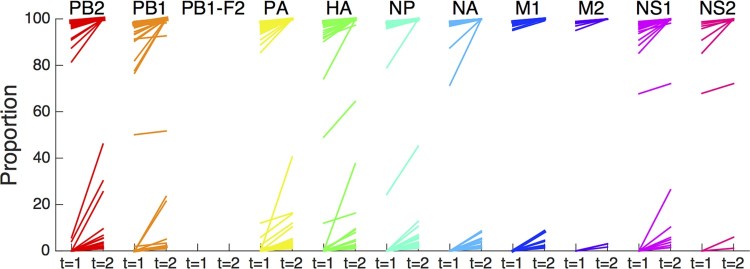
Figure 4.
Proportional increase of variants during course of infection. Represented are 499 variants observed in sequential specimens from 8 patients, depicted per gene segment, that increased by at least 1% over 1–2 days. Initial sample was collected after a median of 8.5 days (range: 5–10) after onset of symptoms. Each line represents a single amino acid variant.

