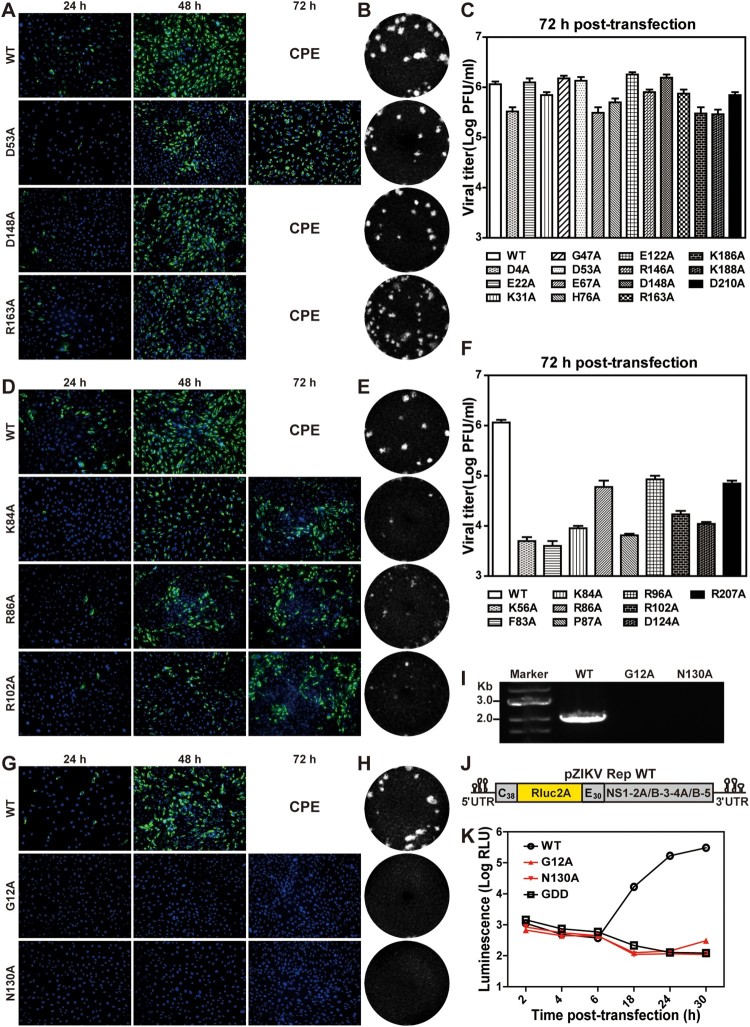
Figure 2.
Characterization of class I, II, and III NS2A mutants. The results of representative mutants from class I (A–C), II (D–F), and III (G–K) are shown. (A) Vero cells were electroporated with equal amounts of ZIKV wild-type (WT) or class I mutant genomic RNAs. At indicated time points, the cells were fixed and subjected to IFA. Viral E protein and nuclei were stained with antibody 4G2 (green) and DAPI (blue), respectively. Cytopathic effect (CPE) is indicated at 72 h post-transfection. (B) Plaque morphologies. Recombinant viruses were subjected to plaque assay. Plaques were developed at day 4.5 post-infection. (C) Viral titers of class I mutants at 72 h post-transfection. The mean values from two independent experiments are shown. Error bars indicate the standard deviations. The limit of detection (LOD) of plaque assay is 10 PFU/ml. (D) IFA of class II mutant RNA-transfected Vero cells. (E) Plaque morphology of class II mutant viruses. (F) Viral titers of class II mutant viruses at 72 h post-transfection. (G) IFA of class III mutant RNA-transfected Vero cells. (H) Plaque morphologies of class III mutant viruses. Plaque assay was performed using culture supernatants collected at day 3 (for WT) and day 5 (for G12A and N130A) post-transfection. (I) RT-PCR analysis. At 5 day p.t., the mutant RNA-transfected cells were washed twice with PBS to remove residual input RNAs. At day 8 p.t., the supernatants of G12A and N130A RNA-transfected cells were subjected to RT-PCR. The WT virus (collected at 72 h p.t.) was used as a positive control. (J) A ZIKV luciferase replicon. C38 and E30 represent the first 38 amino acids of C protein and the last 30 amino acids of E protein, respectively. Renilla luciferase: Rluc. Foot-and-mouse-disease virus 2A sequence: 2A. (K) Transient replicon assay. WT, G12A, N130A, and NS5ΔGDD replicon RNAs were electroporated into Vero cells. Luciferase activities were measured at indicated time points. An average of 3 experiments are presented. Bars represent standard deviations.

