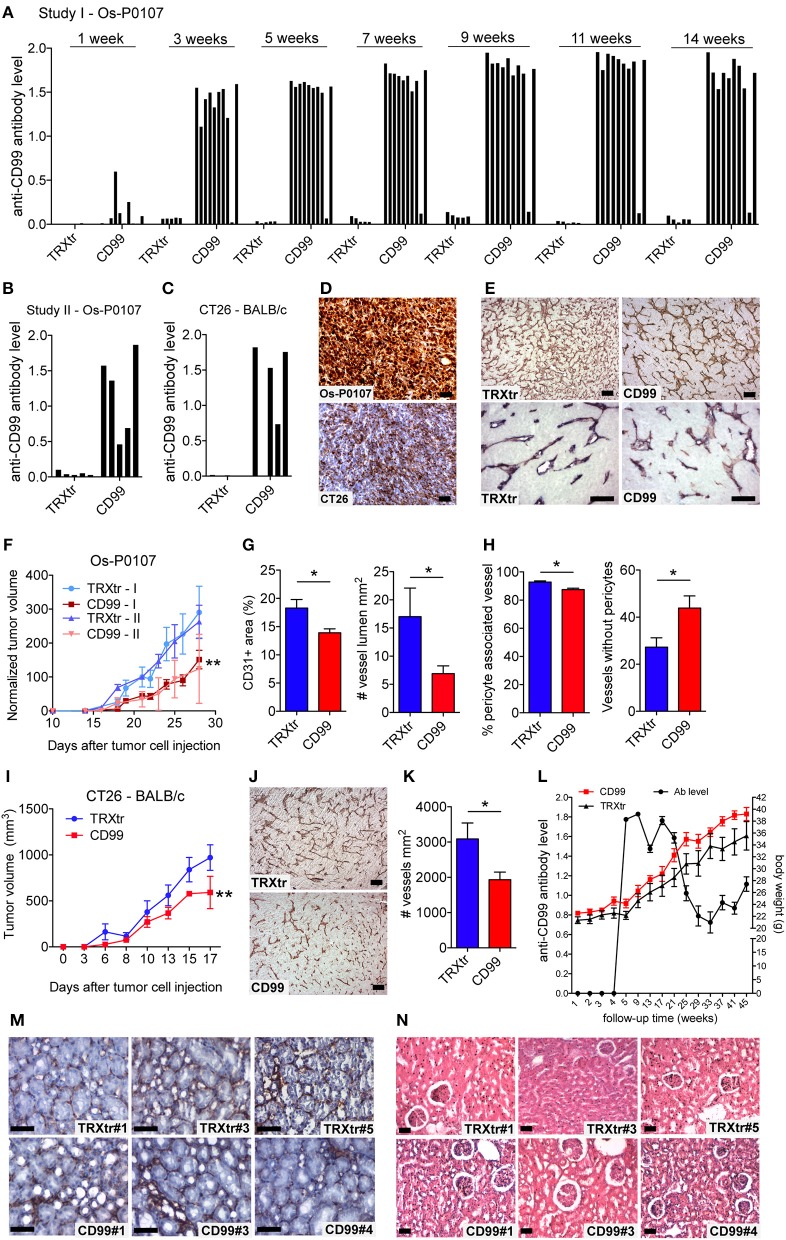
Figure 2.
Induction of a humoral immune response against CD99 inhibits tumor growth and is safe. (A) Anti-mCD99 antibody levels in the sera of the C3H mice (Os-P0107 model) at different time points (weeks) (1st study, Study I; n = 10, CD99). In the sera of TRXtr vaccinated mice (n = 5, TRXtr, control) no anti-mCD99 antibodies were present. (B) Anti-mCD99 antibody levels in the sera of CH3 mice at time point week 9 (after four vaccinations, prior to tumor cell injection) (2nd study, Study II; n = 5, CD99). The control vaccinated mice (n = 5, TRXtr) did not have any anti-mCD99 antibodies. (C) Anti-mCD99 antibody levels in the sera of the BALB/c mice (CT26 model) after four vaccinations (week 7), prior to tumor cell injection. TRXtr-mCD99 vaccinated mice (n = 4, TRXtr-mCD99) responded with the production of anti-mCD99 antibodies, whereas in the sera of TRXtr vaccinated mice (n = 5, TRXtr, control) no anti-mCD99 antibodies were present. (D) Immunohistochemistry staining of CD99 of Os-P0107 (upper panel) and CT26 tumors (lower panel) (8 μm scale bar). CD99 expression in Os-P0107 is higher than in CT26 tumors. (E) Staining of the tumor vasculature (CD31) of Os-P0107 tumors of control vaccinated (TRXtr, left upper panel, scale bar 35 μm) and TRXtr-CD99 vaccinated mice (CD99, right upper panel, scale bar 35 μm). Lower panels show double staining of the tumor vasculature with CD31 (red) and desmin (blue), a pericyte marker (scale bars 50 μm). (F) Tumor growth curves of Os-P0107 in TRXtr-mCD99 vaccinated (CD99; red curves) and control vaccinated mice (TRXtr; blue curves). In both studies (Study I and II) tumor growth was significantly inhibited in TRXtr-mCD99 vaccinated compared to control vaccinated mice. Tumor volume was normalized and growth curves were compared by two-way ANOVA (**P < 0.01). (G) Vessel density of osteosarcoma tumor tissue [CD31+ area (%)]. Vessel density was determined of 3 representative fields per tumor (magnification 100x). Tumors from TRXtr-mCD99 vaccinated mice (CD99; n = 9; red bars) had a lower vessel density compared to control vaccinated mice (TRXtr; n = 4; blue bars), (left panel, *P < 0.05). The number of clear lumina found per field of osteosarcoma tumor (Os-P0107) tissue (magnification 100x, 3 fields per tumor). Mice vaccinated with TRXtr-mCD99 (CD99) had a significantly lower lumen count compared to control vaccinated mice (TRXtr) (right panel, *P = 0.05). (H) Percentage of vessels associated with pericytes in osteosarcoma tumors. The number of vessels with and without pericytes was manually counted of 10 fields per tumor (magnification 200x). The number of vessels associated with pericytes was divided by the total number of vessels per tumor. Tumors of TRXtr-mCD99 vaccinated (CD99, red bars) mice had a significantly lower pericyte coverage compared to control vaccinated (TRXtr, blue bars) tumor tissue (left panel, *P < 0.05). In addition, in tumors of TRXtr-mCD99 vaccinated mice significantly more vessels were found without pericytes than in tumors of control vaccinated mice (right panel, *P < 0.05). (I) Tumor growth curves of CT26 in TRXtr-mCD99 vaccinated (CD99; red curve) and control vaccinated BALB/c mice (TRXtr; blue curve). Vaccination against CD99 significantly inhibited tumor growth in the CT26 tumor model as well (two-way ANOVA; **P < 0.01). (J) Representative images of CD31 stained CT26 tumors of control vaccinated mice (TRXtr, upper panel) and TRXtr-mCD99 vaccinated mice (CD99, lower panel) (scale bars 35 μm). (K) Vessel density of CT26 tumor tissue. Vessel density was determined of 3 fields per tumor (magnification 100x). Significantly fewer vessels were counted in tumors of TRXtr-mCD99 vaccinated mice (CD99; n = 4; blue bar) compared to control vaccinated mice (TRXtr; n = 3; red bar) (*P < 0.05). (L) Vaccinated mice with high anti-CD99 antibody levels in their blood (antibody level is shown on the left y-axis; curve with marked black circles) were followed-up for a period of 45 weeks. No difference in body weight (right y-axis) between TRXtr-mCD99 vaccinated (CD99, red curve, squares) and control vaccinated mice (TRXtr, black curve, triangles) was found between the groups. Values are depicted as mean ± SEM. (M) Kidneys stained for CD31 (brown-reddish staining) of TRXtr-mCD99 (CD99) and control vaccinated (TRXtr) mice from the long-term follow-up study (time point 45 weeks). Tissues were counter stained with Mayer's hematoxylin (blue) (scale bar 50 μm). No difference in tissue morphology was found between TRXtr-mCD99 vaccinated and control vaccinated mice. (N) Hematoxylin eosin staining of kidneys of TRXtr-mCD99 (CD99) and control vaccinated (TRXtr) mice from the long-term follow-up study (time point 45 weeks) (scale bar 35 μm). No difference in tissue morphology was observed between the CD99 and TRXtr group, indicating that vaccination against CD99 is safe.

