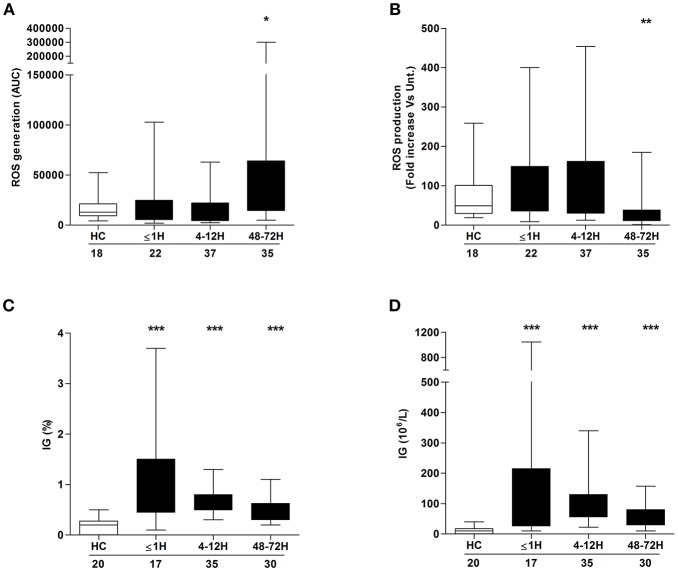
Figure 2.
Neutrophil ROS production and immature granulocyte count post-injury. Comparison of basal (A) and PMA-induced (B) ROS production by neutrophils isolated from healthy controls (HC) and trauma patients. Data are presented as area under the curve (AUC) (A) or fold increase above vehicle treated controls (B). (C,D) Frequency (C) and absolute number (D) of immature granulocytes (IG) in peripheral blood samples from healthy controls (HC) and trauma patients. Number of samples analyzed are shown below each time-point. *p < 0.01, **p < 0.001, ***p < 0.0001 vs. HC.

