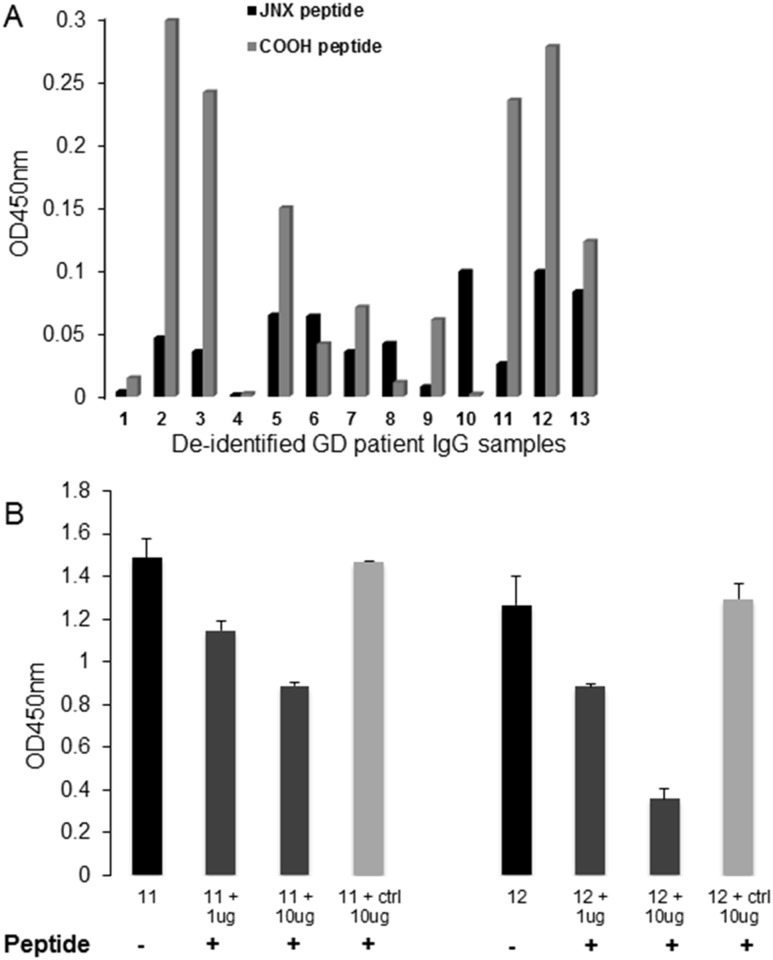
Figure 6.
Antibodies to TSHRv1.3 epitopes in patient sera. Peptides to the JNX and the COOH of TSHRv1.3 were used in our peptide ELISA. (A) The bar graph shows the binding response of 13 different GD IgGs (4 μg per well) indicated on the x-axis against the two peptides marked by black and light gray bars. Data represent OD values after subtraction of mean OD ±2 SD obtained from 10 control IgG samples. (B) Two IgG samples (samples 11 and 12) that were strongly positive were used to test for specificity of binding. The 6-μg IgG of these samples was first absorbed with 1 and 10 μg of the COOH peptide for 30 minutes at 37°C. An unrelated control peptide treated with the same concentrations of IgG was also used in the absorption, as indicated by the matrix below the x-axis. Addition of the specific peptide reduced the OD by >50%, suggesting specificity of patient IgG to the v1.3 peptides.

