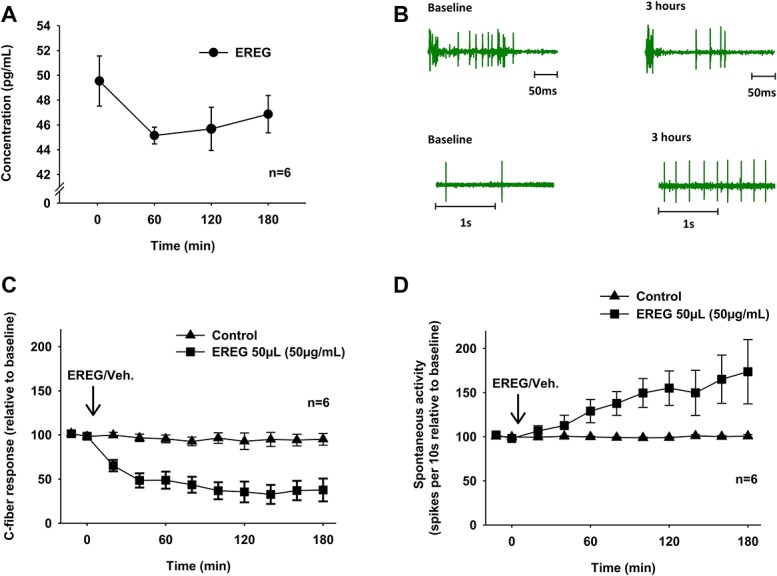
Figure 1.

(A) Epiregulin (EREG) levels in medium conditioned by NP relative to EGFR signal in medium without NP (background); 2, 60, 120, and 180 minutes after NP harvesting. (B) Example of single cell recordings at baseline and 180 minutes after administration of EREG. (C) The C-fiber response relative to baseline after administration of 50 µL of EREG (50 µg/mL) or vehicle (Veh.). A decrease in C-fiber response was observed; P < 0.001 rmANOVA. (D) The spontaneous activity relative to baseline after 50 μL of EREG (50 μg/mL) or vehicle (Veh.). An increase in spontaneous activity was observed; P = 0.026, rmANOVA. EGFR, epidermal growth factor receptor; NP, nucleus pulposus; rmANOVA, repeated-measures analysis of variance.
