
Figure 2.
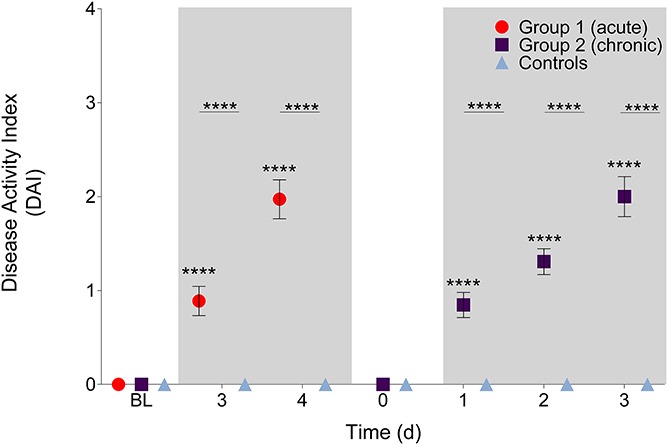
Disease Activity Index scores during the acute and chronic colitis phases. Disease Activity Index scores increased significantly during acute DSS exposure compared with BL and controls on days 3 and 4 (P < 0.0001). Disease Activity Index scores increased significantly during chronic DSS exposure compared with BL on day 0 (before DSS treatment began again) and controls on days 1, 2, and 3 (P < 0.0001). Shaded boxes represent when DSS treatment was given. ****P < 0.0001. Data presented as mean ± SEM. BL, baseline; DSS, dextran sulfate sodium.